

NDVI assessment of
the internal health of
an individual tree may be erroneous. Why?
Please read our research report at this link.

To assess the internal health of
an individual tree, we have found that the spectral reflectance of
the Red Edge band is similar
in pattern to that of the NIR band. So the inclusion of this band
is additional.
Please refer to the following charts at this link.

A New Technology to Detect Internal Warning Indicators of Stressed Trees
Before External Signs and Symptoms Are Discernible
Time-saving, Cost-effective and Non-invasive
Enhances health detection and management of individual trees
Provides early information for arborists to undertake field diagnosis and treatment
For health detection services provided by Geocarto, please contact us.


Geocarto Tree Health Detection System (GTHDS)
reveals the following conditions
Case study 1
Case study 2
Case study 3
Case study 4
Case study 5
Case study 6
Case study 7
Case study 8
Case study 9
Case study 10
Case study 11
Case study 12
Case study 13
Case study 14
Case study 15
Case study 16
Case study 17
Case study 18
Interpretation and Analysis

A New Technology......
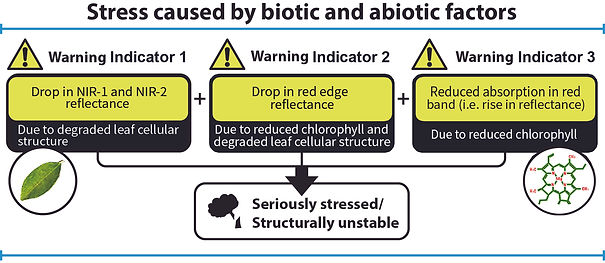
This new technology reveals tree stress caused by biotic and abiotic factors, but it is not designed to diagnose the cause of the stress, which has to be investigated in the field.
It is based on variation in chlorophyll content and degradation of leaf cellular structure. These symptoms are not discernible externally.
Such internal waning indicators are shown before any external signs can be observed. Hence they provide objective and early information to assist arborists and tree management teams to carry out remedial measures expeditiously.

Internal Warning Indicators

Implication of the Internal Warning Indicators
Spectral Reflectance: A New Technology......
What can changes in chlorophyll content and leaf cellular structure tell you about a tree? Combining satellite imagery data, site analysis, and knowledge of indicators of decay, arborists may better position themselves to make a recommendation on important management decisions. (Editor's note about this article)
Integrated Approach: Tree Stress Monitoring
In a follow-up to an article published in Arborist News last year, this article looks at how satellite technology allows urban foresters to observe tree stress indicators over time. (Editor's note about the follow-up article)
A White Paper Published by DigitalGlobe
AComp data provided by DigitalGlobe facilitates data processing and enhances detection of stressed tree (published on 01-JUN-2017)
Tree Structural Condition & Spectral Reflectance
How do we know if photosynthesis has accumulated enough carbohydrates for the defense of decay in trees?
Early Detection of Tree Stress
An early detection technology revealing internal health condition before any external signs and symptoms are discernible

GTHDS
Geocarto Tree Health Detection System (GTHDS) is based on satellite remote sensing technology. It uses high resolution satellite data collected by WorldView-2 and WorldView-3 of 2 m and 1.2 m multi-spectral resolution respectively. These satellites were launched by DigitalGlobe on October 8, 2009 (WV-2) and on August 13, 2014 (WV-3). Resolution refers to the pixel dimension of the image. If a tree canopy is covered by 4 pixels, we can effectively monitor that tree.
Our system generates spectral reflectance curves from these pixels which have been specially calibrated with DigitalGlobe's proprietary algorithm called AComp (Atmospheric Compensation). It automatically measures and compensates for atmospheric variability from pixel to pixel within a scene to ensure consistent and reliable result.
We use “lossless” pansharpening process to fuse panchromatic data of 50 cm – 30 cm resolution with multispectral data of 2 m – 1.2 m resolution collected by WorldView-2 and WorldView-3 satellites respectively. This lossless pansharpening technique will retain the fidelity of the original data without losing the spectral information content from each pixel for spectral reflectance analysis. In fact, 50 cm – 30cm is the highest satellite imagery resolution commercially available at present.

Trees
Spectral reflectance analysis is designed to monitor an individual tree instead of a forest. Different tree species show different variation in spectral reflectance. We therefore compare the spectral reflectance of the same tree in the same month or same season of different years for which satellite data are available. As WorldView-2 and WorldView-3 high resolution satellites have collected global data since the launch dates, we can review the changes in health condition of an individual tree retrospectively.
Improving
If the spectral reflectance in near-infrared and red edge bands increases, while absorption in the red band also increases (i.e. drop in reflectance), the indication is improvement over that period.

Stable
When there is little variation* in the spectral reflectance over a period, a stable condition is indicated over that period.
*When the reflectance difference between two dates does not exceed the following percentage, the condition is regarded as "stable" (NIR: 2%, Red Edge: 1%, Red: 0.5%)

Fluctuating
If the spectral reflectance over a period rises and drops, or drops and rises over a period, the indication is fluctuation.

Declining
When the spectral reflectance of NIR and red edge bands declines while the spectral reflectance of red band continues to rise (i.e. drop in absorption), the indication is deterioration over that period.

Removed

Collapsed


(AComp data and "Lossless" pansharpened data)
Satellite
Resolution
Number of Bands
Cost of satellite data per km

Data cost
Name
WorldView-2
WorldView-3
Company
DigitalGlobe, Inc
Launch Date
2009-10-8
2014-8-13
Coverage
Satellite data of 60km x 60km to cover the whole HKSAR can be acquired in a single pass
Panchromatic
50 cm
8 Multispectral
2.0 m
30 cm
1.20 m
More than 90 days
US$ 19 (8 bands)
Less than 90 days
US$ 29 (8 bands)
US$ 24 (8 bands)
US$ 34 (8 bands)
Geocarto was the sole reseller of WorldView-2 & WorldView-3 satellite data in Hong Kong and Macau.

Contact Us
Geocarto International Centre Ltd.
Room 1302, 13/F, Trend Centre,
29-31 Cheung Lee Street,
Chai Wan, Hong Kong
Tel.: (852) 2546 4262
Email: geocarto@geocarto.com
