
Geocarto International Centre Ltd.
Tree Health Detection in Hong Kong using Remote Sensing

Geocarto Tree Health Detection System (GTHDS)
Enhances monitoring and management of individual trees
Reveals internal warning signs for arborists to undertake field diagnosis and treatment


Tree Stress Monitoring in Hong Kong
Monitoring tree stress from space using WorldView-2 or WorldView-3 high resolution satellite data
Time-saving and Cost-effective
New technology to detect 3 Warning Signs revealed by stressed trees before collapse
New!
We have added the following charts in the gallery demonstrating our study on stressed trees.
Chart 21 Spectral Reflectance Reveals Tree Stress
Chart 22 Spectral Reflectance Analysis of a Stressed Tree, 2010-2016
Chart 23 Reflectance Analysis Reveals Warning Signs
Chart 24 Warning Signs Revealed by a Stressed Tree
Chart 25 Changes in the Health Condition of a Stressed Tree
Chart 26 Deterioration of a Stressed Tree
Chart 27 What do Stressed Trees reveal before Collapse
Chart 28 What do Stressed Trees reveal before Collapse generated with AComp Data
Chart 29 Collapsed tree in Fanling
Chart 30 Collapsed tree in Berlin
Chart 31 Collapsed tree in Cincinnati
Chart 32 Collapsed tree in Chiswick
Chart 33 Collapsed tree in Düsseldorf
Chart 34 Collapsed tree in Maisons-Alfort
Chart 35 Collapsed tree in Singapore
Chart 36 Collapsed tree in Sydney
Chart 37 Collapsed tree in Whittier
Chart 38 Collapsed tree in Vancouver
Chart 39 Collapsed tree in Singapore
Chart 40 Collapsed tree in Singapore
Chart 41 Removed tree in Lei Yue Mun Park
Chart 42 Stonewall Tree in Forbes Street
Chart 43 A Stressed Tree Before Death
Chart 44 Highly Fluctuating Health Condition Before Collapse
Chart 45 Biotic and Abiotic Factors
Chart 46 Collapsed Tree in Pasadena
Chart 47 Collapsed Tree in Stubbs Road
Chart 48 Monitoring of an Old and Valuable Tree (2010 - 2020)
Chart 49 Collapsed Tree in Marsiling Park, Singapore
Chart 50 Collapsed Tree in Central Park, New York
Chart 51 Collapsed Trees in South Asia
Chart 52 Removed Trees on Bonham Road, the University of Hong Kong
Chart 53 Spectral Reflectance Analysis Can Detect Internal Abnormalities (English Version)
Chart 54 Spectral Reflectance Analysis Can Detect Internal Abnormalities (Chinese Version)
Chart 55 Collapsed Tree at Perth Street, Hong Kong (English Version)
Chart 56 Collapsed Tree at Perth Street, Hong Kong (Chinese Version)
Check out our newest graphs on satellite images and tree health detection:
Chart 57 Spectral Reflectance Abnormalities of termite-infested trees
Chart 58 Tree Health Assessment (misconceptions of NDVI usage)
Chart 59 Satellite coverage in Greater Bay Area
Chart 60 Satellite coverage in Greater Bay Area
Chart 61 Assessing the health of the collapsed tree on Perth Street, Hong Kong
Chart 62 Assessing the health of the collapsed tree on Perth Street, Hong Kong
Chart 63 Two Impact Factor Analysis on Termite-infested trees
Chart 64 Chinese SuperView Neo 3-01 and 3-02 Satellites
Chart 65 Chinese SuperView Neo 3-01 and 3-02 Satellites
Chart 66 Effective Use of Two Impact Factor Analysis on Monitoring Tree Health
Chart 67 Red Edge Reflectance Curve
Chart 68 Red Edge Reflectance Curve
Chart 69 SuperView Neo 3-01 & 3-02 Satellites
Chart 70 Surface Reflectance Comparison
Chart 71 15 Trees infested with termites (part 1)
Chart 72 15 Trees infested with termites (part 2)

Introducing WorldView-2 & WorldView-3
Providing satellite data to cover the whole HKSAR in a single pass
(Image Copyright © DigitalGlobe)
WorldView-2 is the first high-resolution 8-band multispectral commercial satellite. Operating at an altitude of 770 km, WorldView-2 provides data of 40 cm to 50 cm panchromatic resolution and 1.85 m multispectral resolution. The satellite has an average revisit time of 1.1 days and is capable of collecting up to 1 million square km of 8-band imagery per day.
WorldView-3 is the first high resolution super-spectral commercial satellite. Operating at an altitude of 617 km, it provides data of 30 cm panchromatic resolution, 8 bands of 1.24 m multispectral resolution, and 8 additional SWIR (Shortwave Infrared) bands of 7.5 m resolution. The satellite has an average revisit time of less than 1 day and is capable of collecting up to 680,000 square km of 8-band data per day.
Both satellites are able to act like a paintbrush, sweeping back and front to collect very large continuous area of panchromatic imagery of 50 cm to 30 cm resolution and multispectral imagery of 1.85 m to 1.24 m resolution in a single pass. The whole Hong Kong region of 60 km and 60 km can be covered in 5 strips in just one pass.

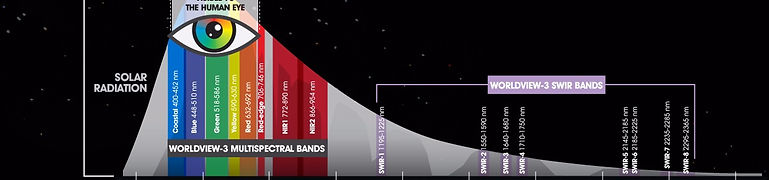
Spectral Reflectance Analysis
Detects 3 warning signs revealed by stressed trees before collapse caused by biotic and abiotic factors. The warning signs are (1) drop of NIR-1 and NIR-2 reflectances, (2) shift of red edge band to shorter wavelength and (3) reduced absorption in red band.
Stress caused by biotic and abiotic factors
Revealed by spectral reflectance curves
Healthy Trees
Stressed Trees
1
Drop in NIR-1 and NIR-2 reflectance
Due to degraded leaf cellular structure

NIR
2
Shift of red edge band to shorter wavelength
Due to reduced chlorophyll

Red Edge
3
Reduced absorption in red band
Due to reduced chlorophyll

Red

Case Studies
All the following trees showed the above 3 warning signs before collapse

Tree on steep slope


Tree on stone wall

Tree on level ground

Case 1 - Tree on steep slope
We studied a stressed tree on a steep slope in Lower Albert Road near former Central Government Offices. It collapsed on 20 July, 2015.
The spectral reflectance curves in this case were generated from the WorldView-2 data collected on 25 May, 2010 and 17 April, 2015. All 3 warning signs were revealed before its collapse.
2010
2015


Case 2 - Tree on stone wall
We studied a stressed tree on a stone wall in Bonham Road near Centre Street. It collapsed on 22 July, 2015.
The spectral reflectance curves in this case were generated from the WorldView-2 data collected on 25 May, 2010 and 17 April, 2015. All 3 warning signs were revealed before its collapse.
2010
2015


Case 3 - Tree on level ground
We studied a stressed tree on level ground in Bonham Road near King's College. It collapsed on 19 April, 2015.
The spectral reflectance curves in this case were generated from the WorldView-2 data collected on 25 May, 2010 and 17 April, 2015. All 3 warning signs were revealed before its collapse.
2010
2015


Explore our charts
 Chart 1How is Hong Kong region imaged in one pass? |  Chart 2How are spectral reflectance curves generated? |  Chart 3What are the spectral signatures shown by different materials? |
|---|---|---|
 Chart 4What is the spectral reflectance pattern shown by different tree species? |  Chart 5How is stressed condition revealed? |  Chart 6What is the difference in NIR and SWIR reflectance? |
 Chart 7Can WV-2 and WV-3 data be used to monitor the same tree? |  Chart 9Why is there greater difference in red edge reflectance between 2011 and 2014? | 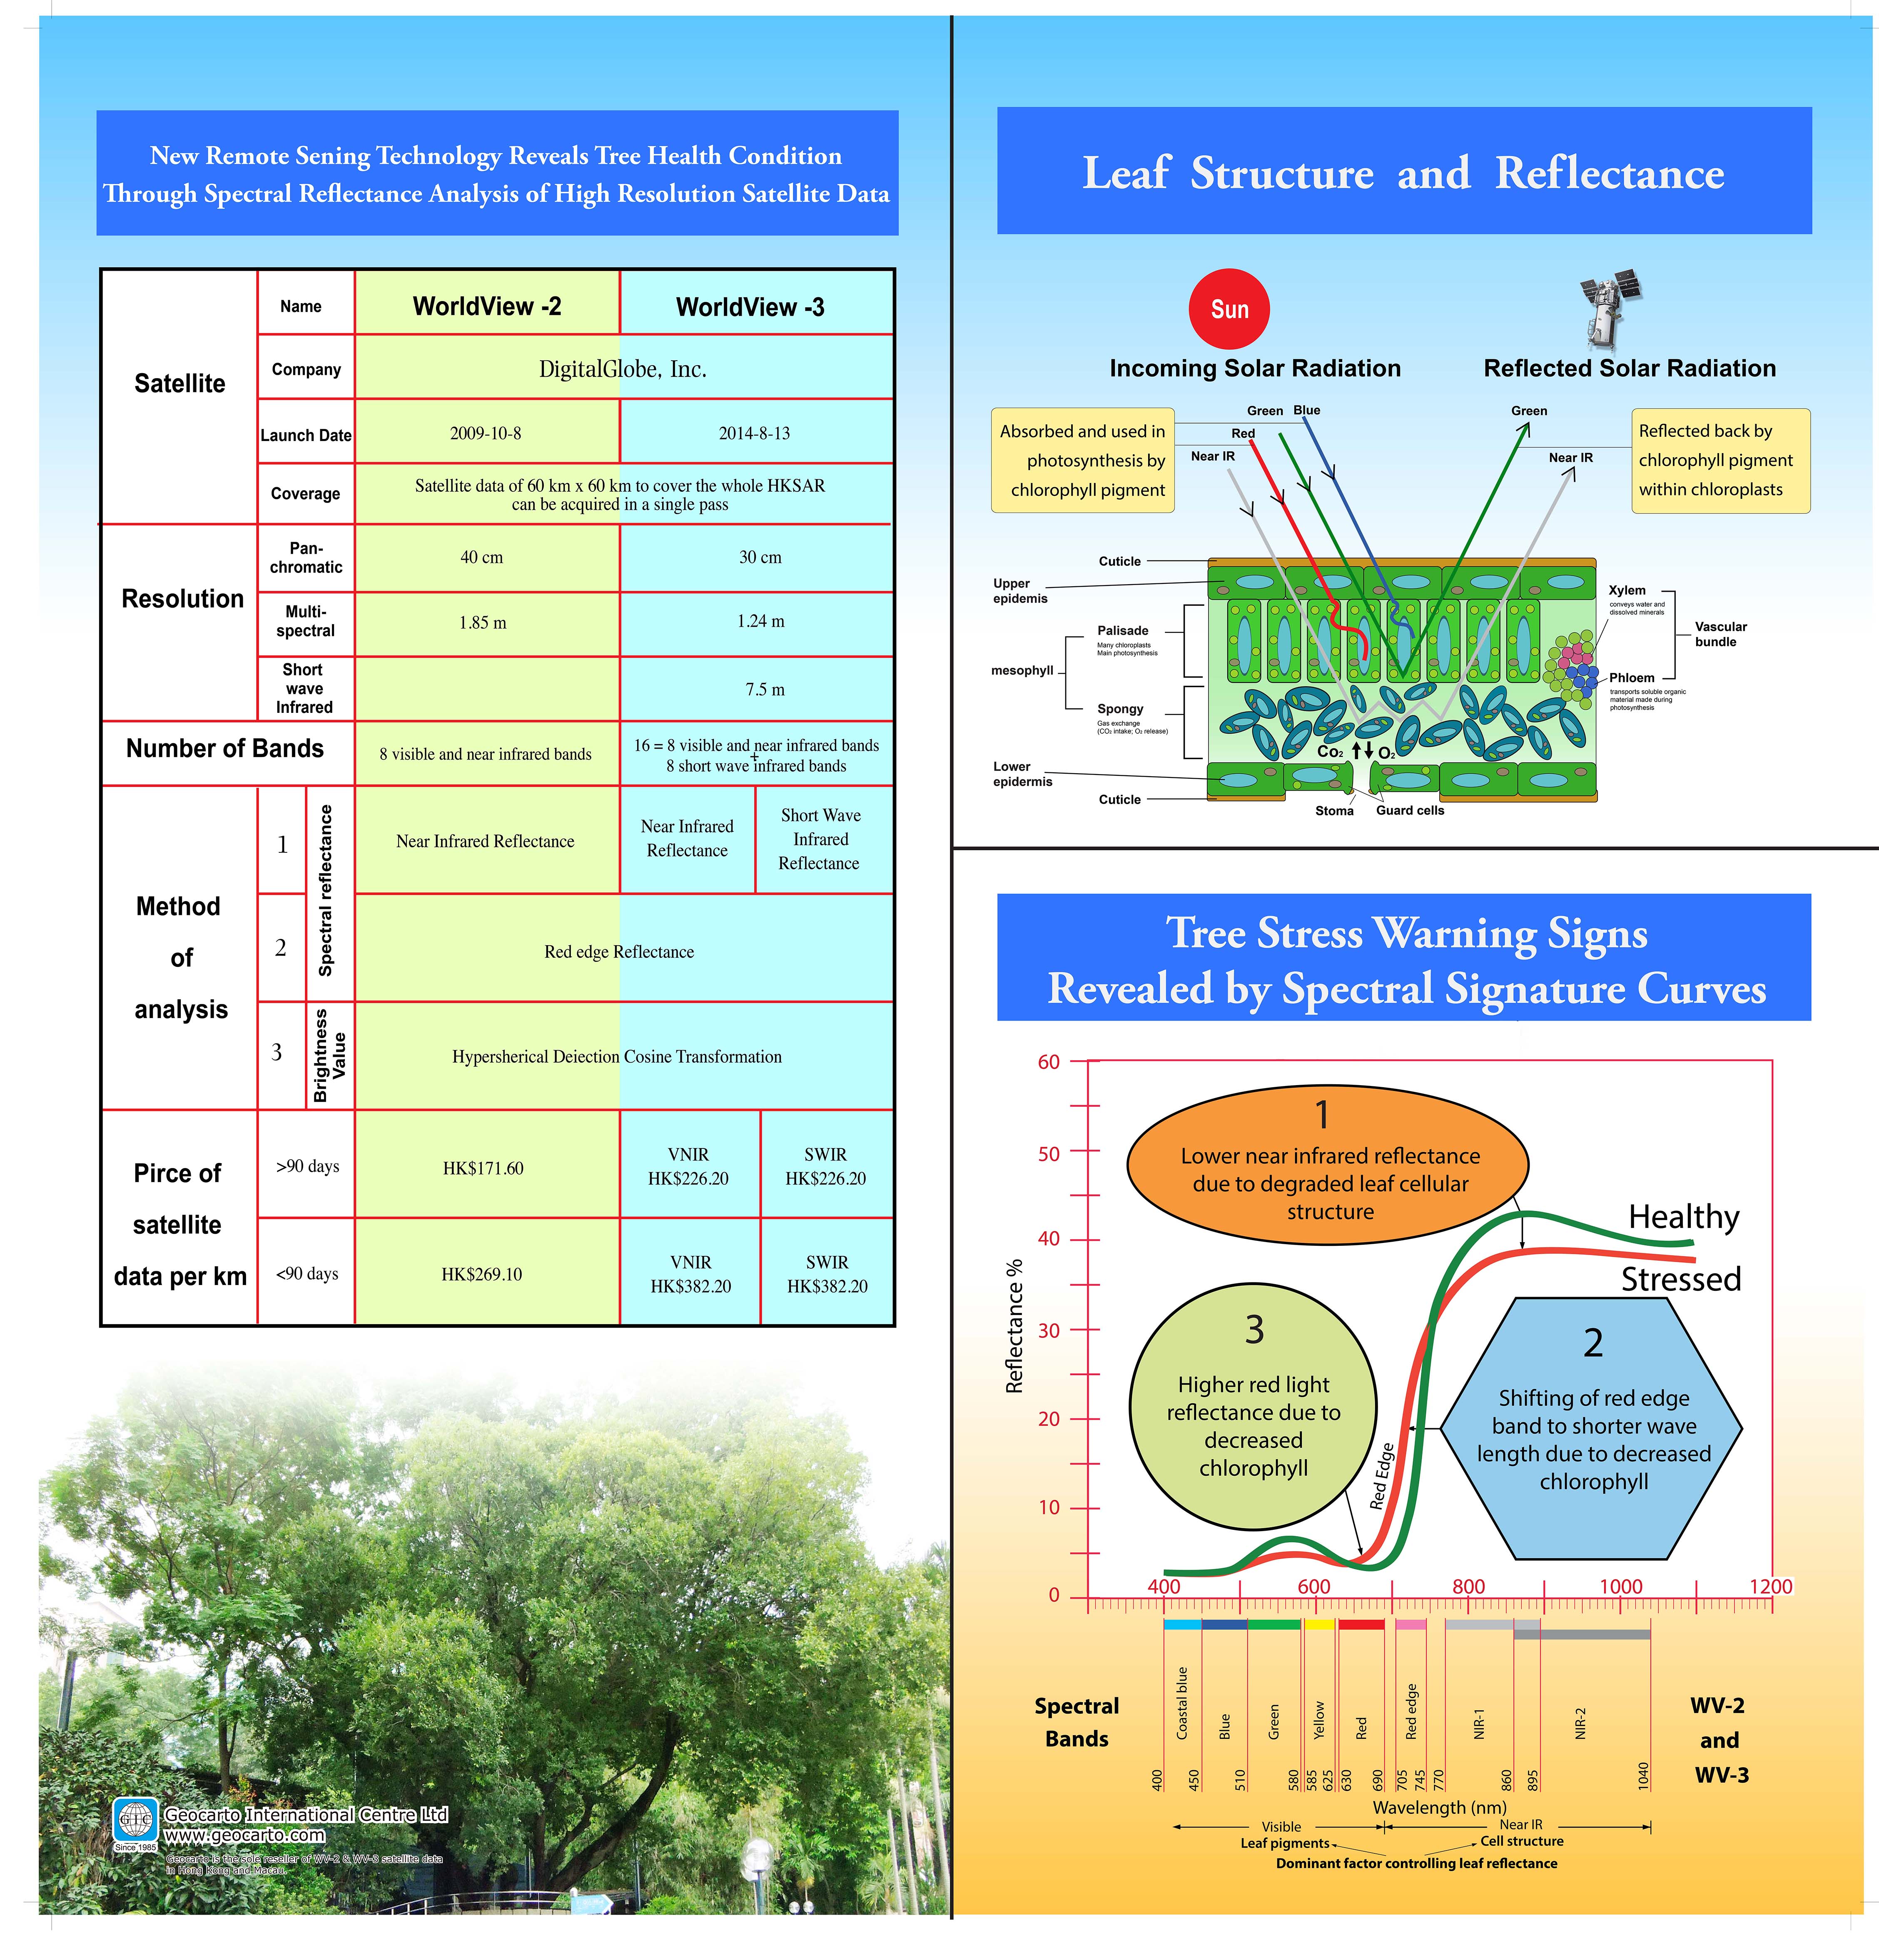 Chart 8What are the warning signs revealed by a tree before collapse? |
 Chart 10Which tree shows the greatest variation in NIR reflectance? |  Chart 12What are the warning signs shown? |  Chart 11Which tree shows the least variation in NIR reflectance? |
 Chart 13What are the warning signs shown? |  Chart 14What are the warning signs shown? |  Chart 15What are the warning signs shown? |
 Chart 16What are the warning signs shown? |  Chart 17Tree in Good Condition |  Chart 18Contrast between Two Trees |
 Chart 19What do stressed trees reveal before collapse? |  Chart 20What variations are shown in the spectral reflectance curves of the three trees: 2, 3 and 6? |  Chart 21How does an integrated approach enhance tree monitoring and management? |
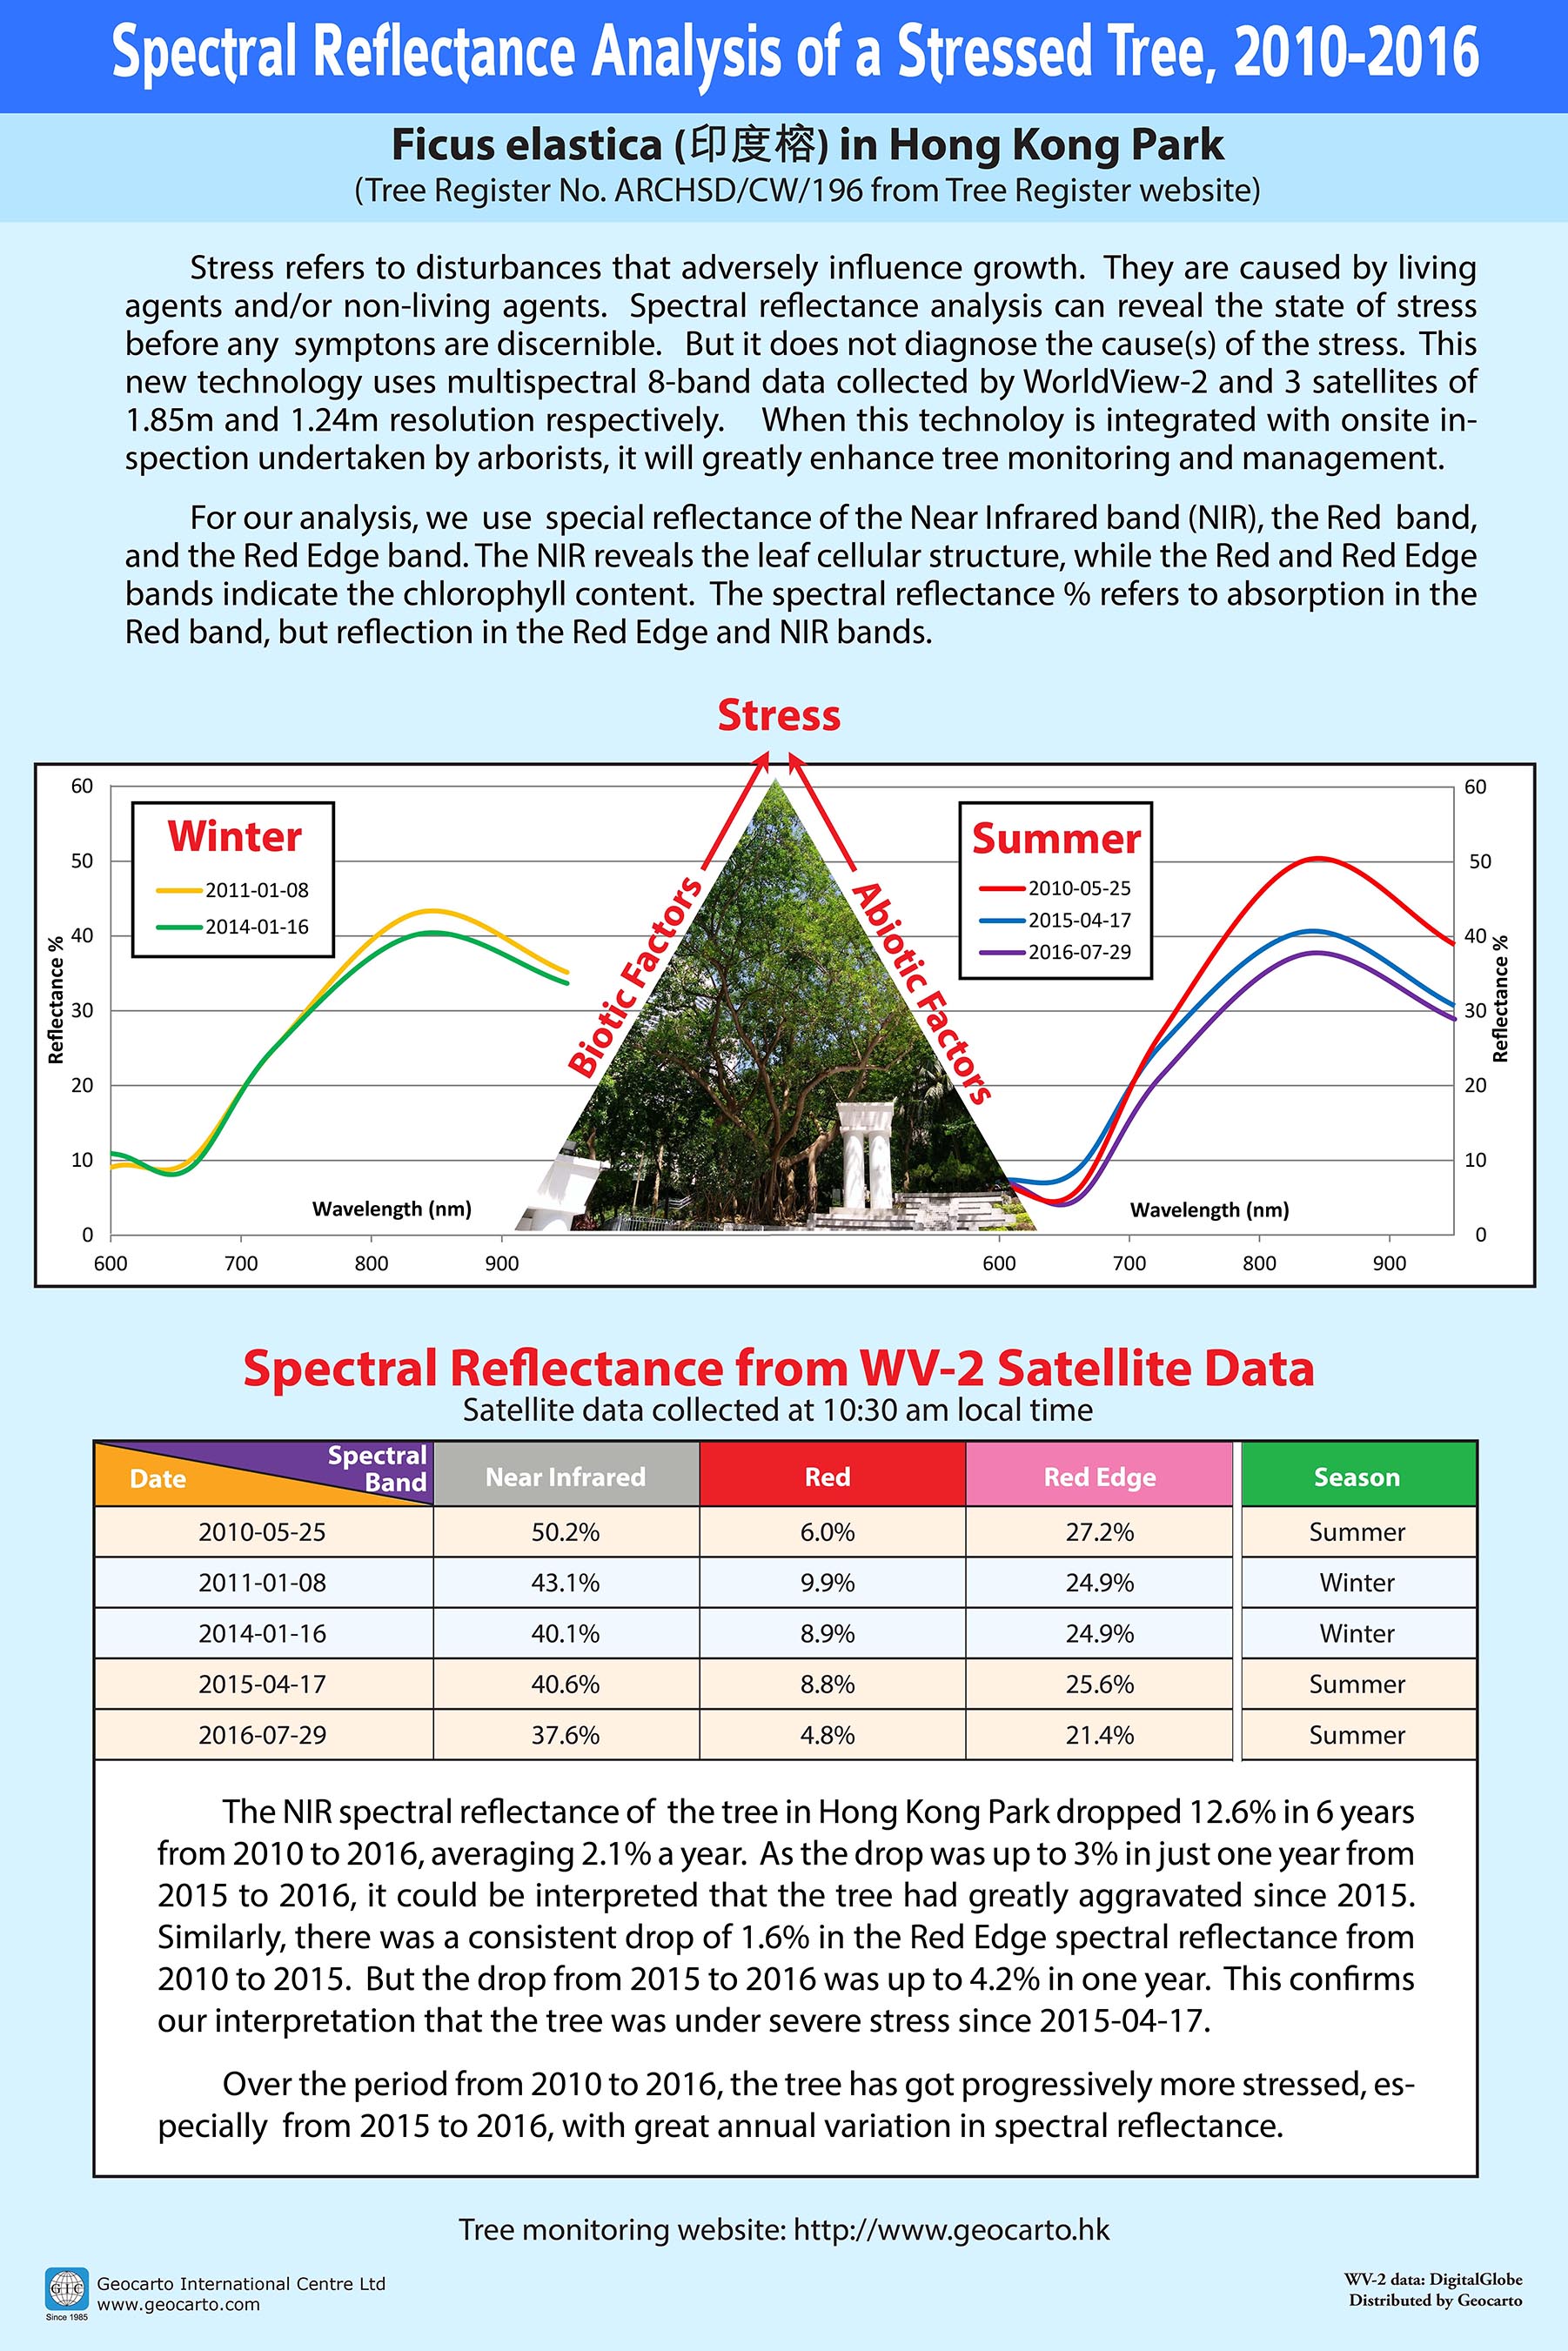 Chart 22When did the tree become aggravated? | 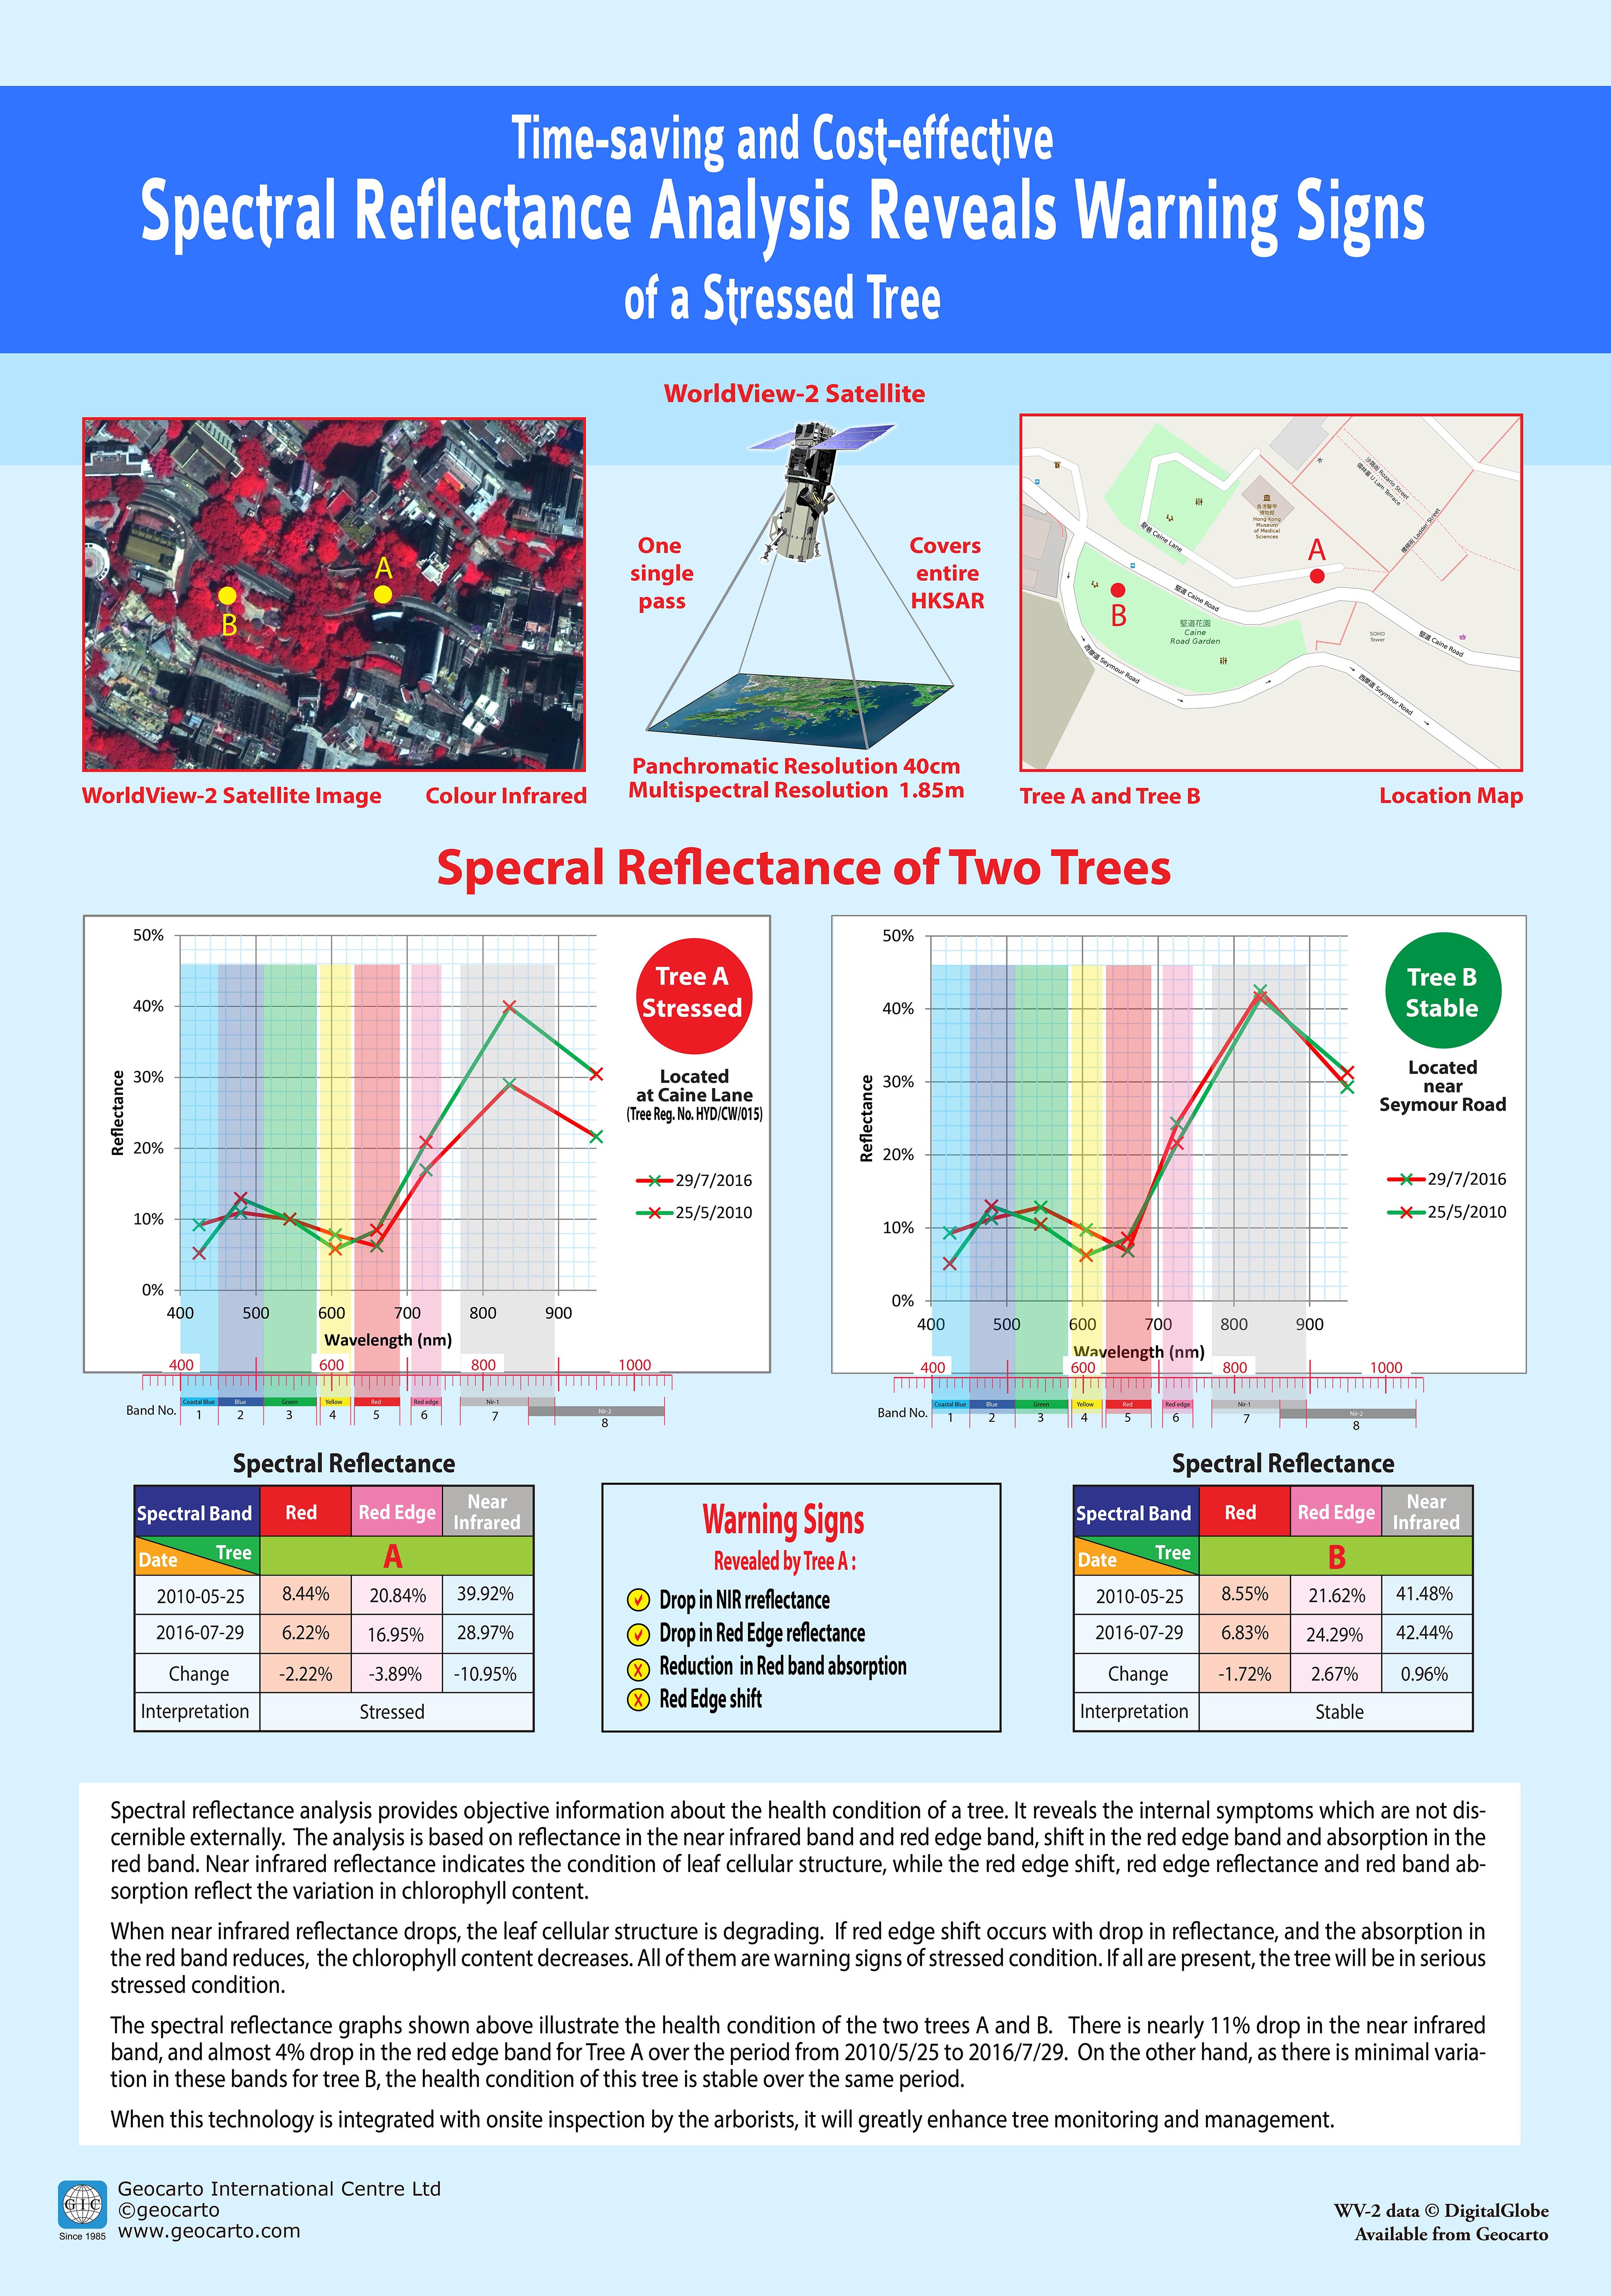 Chart 23What warning signs are revealed? | 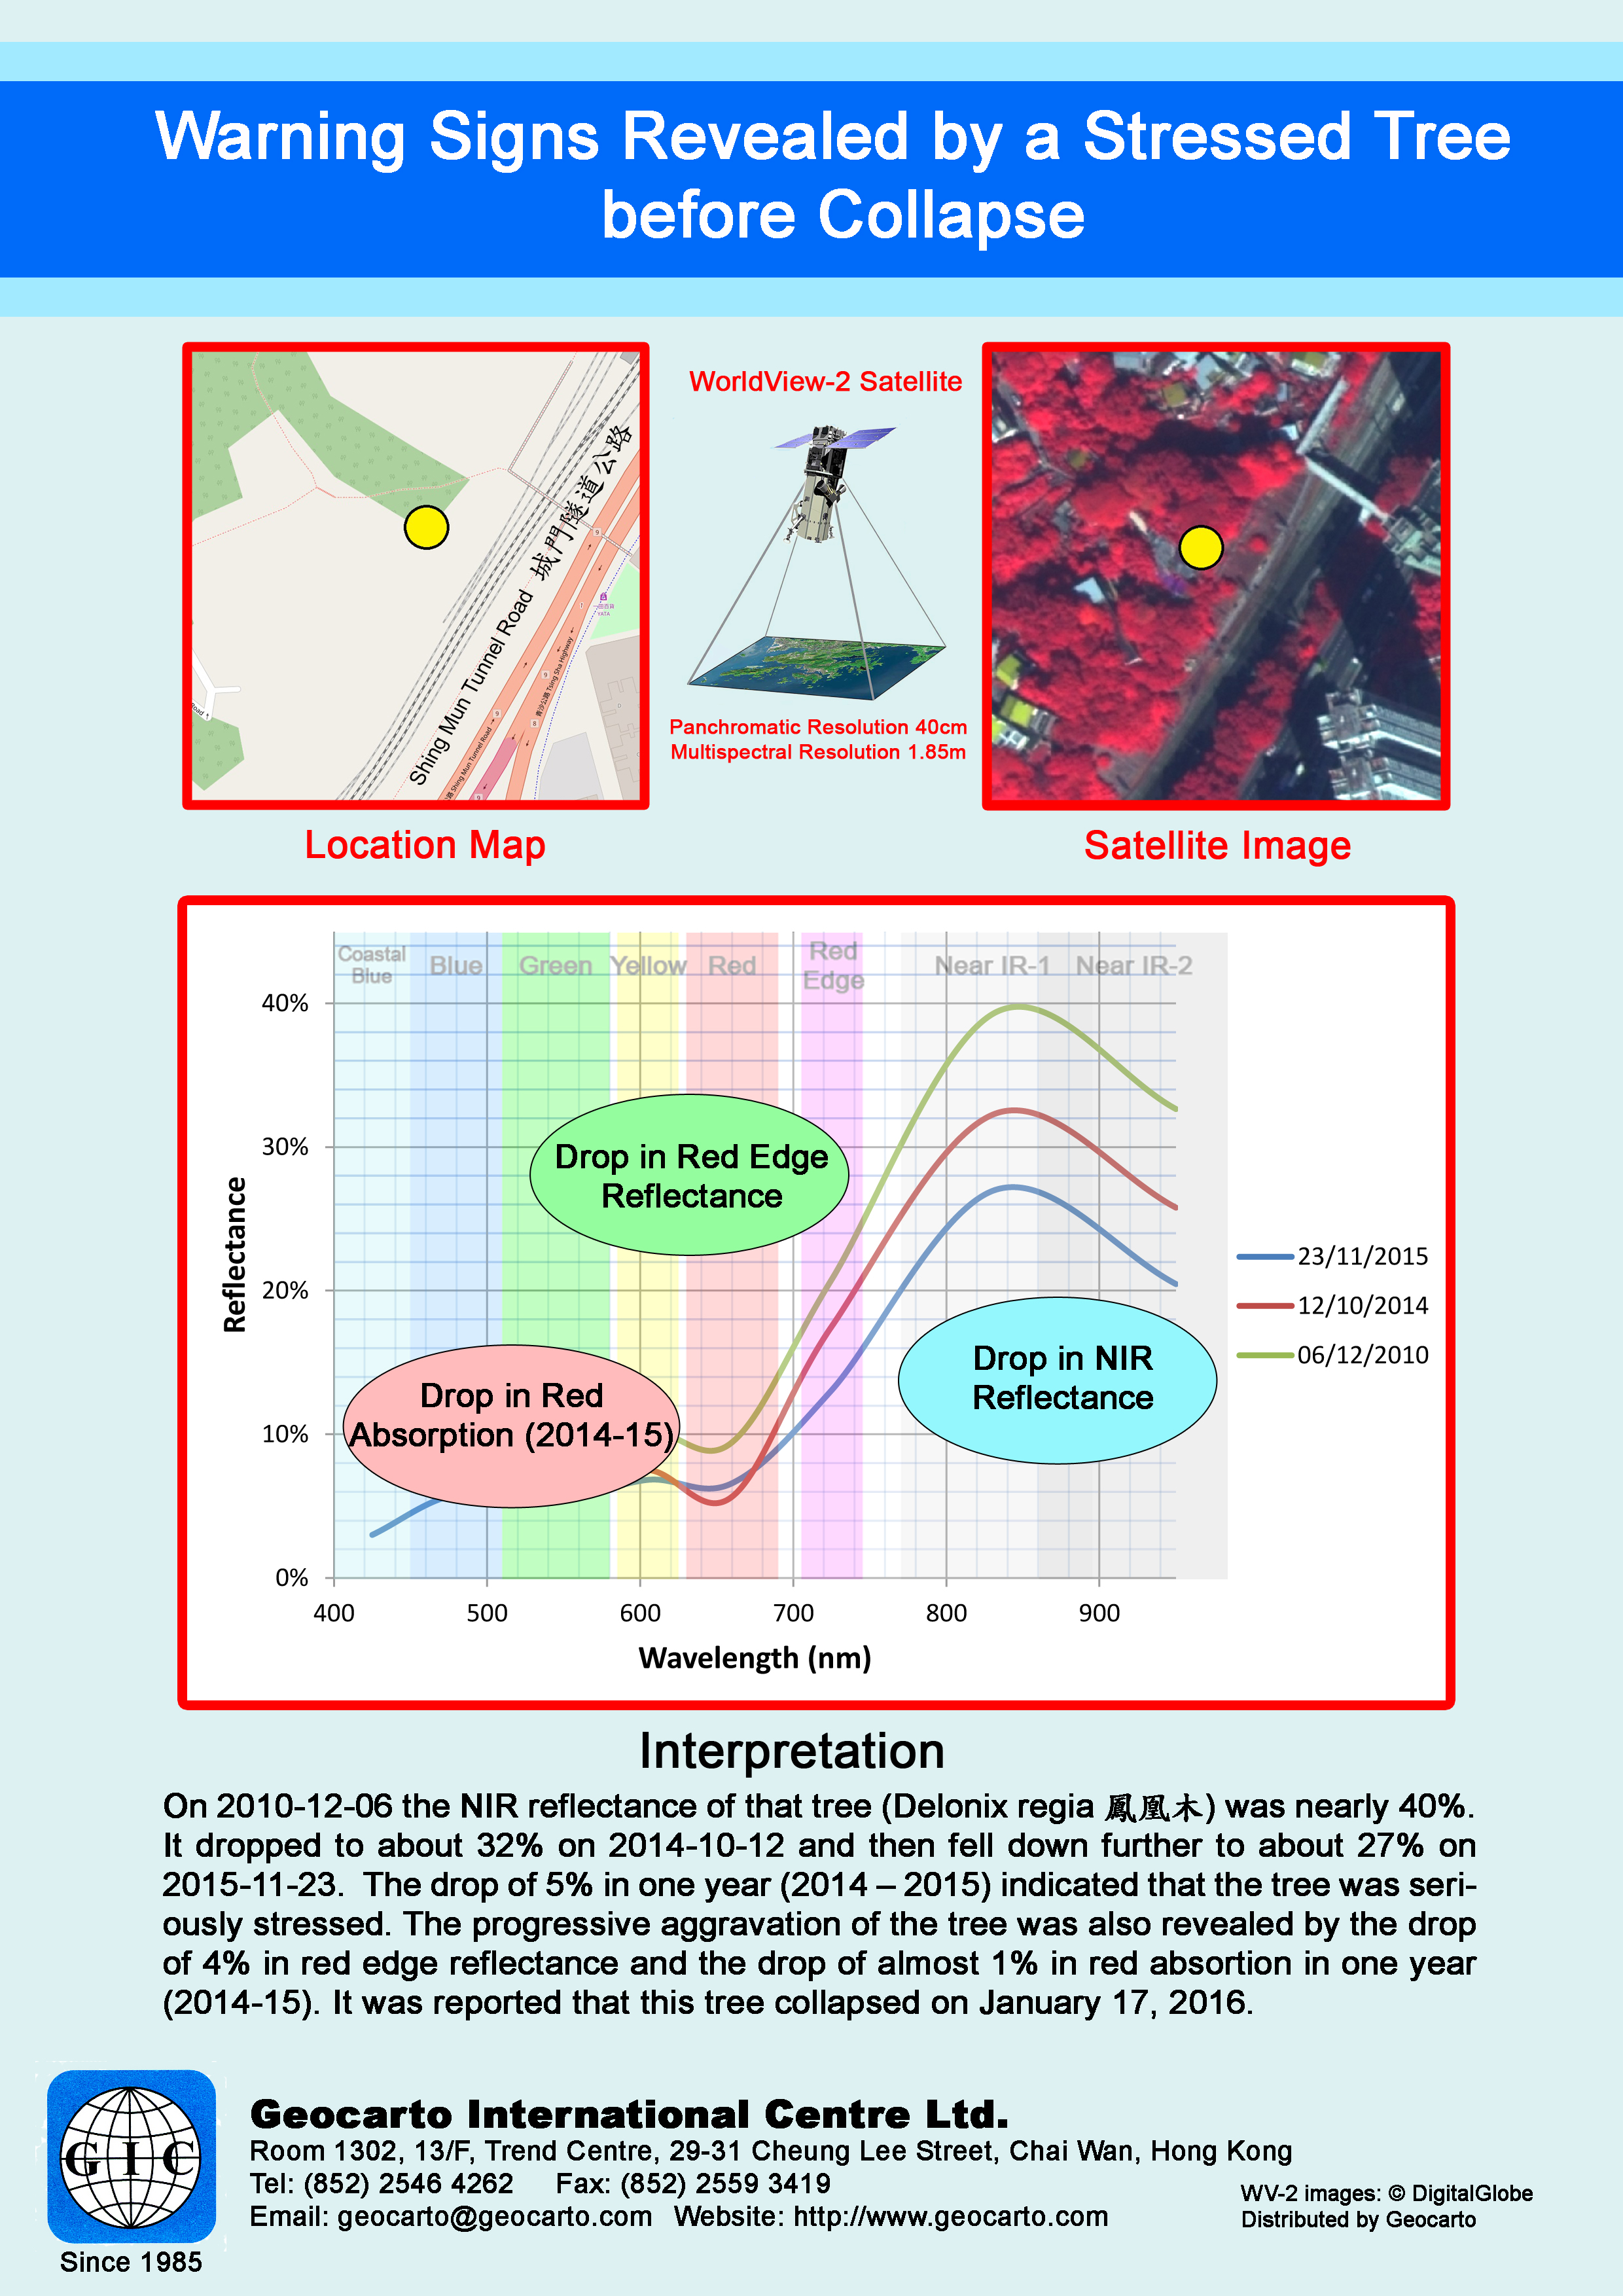 Chart 24What warning signs are revealed? |
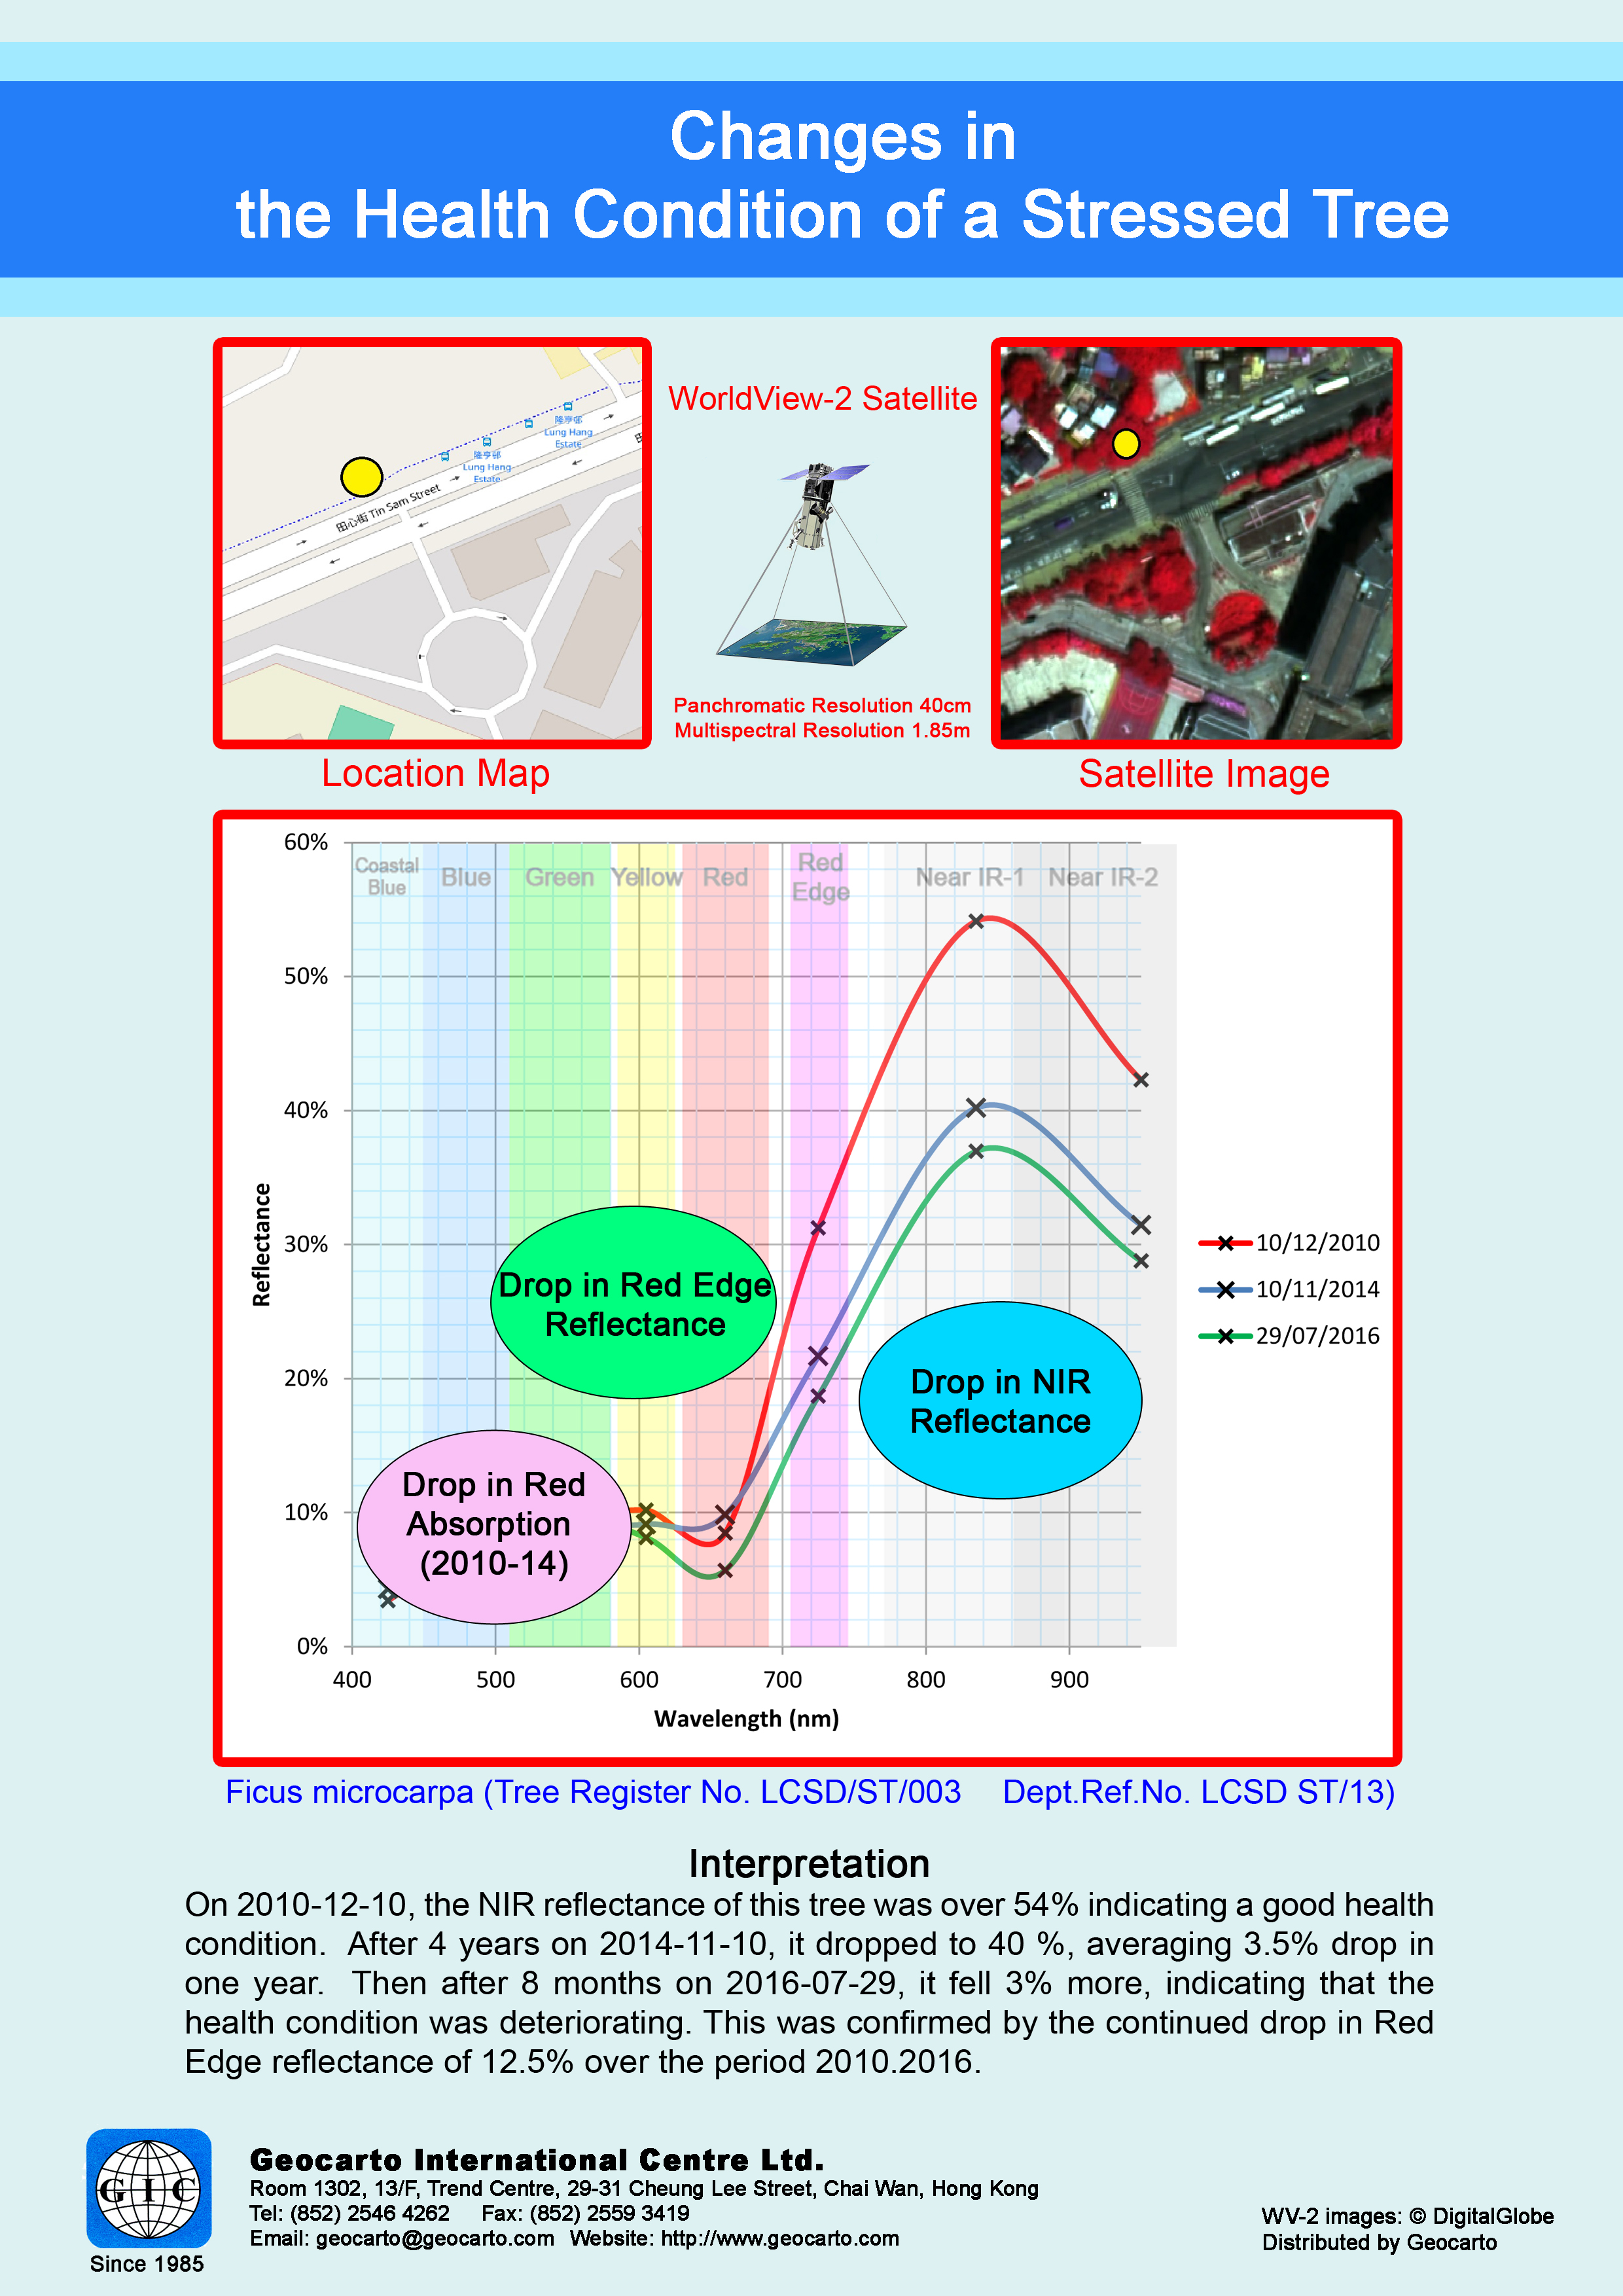 Chart 25What warning signs are revealed? | 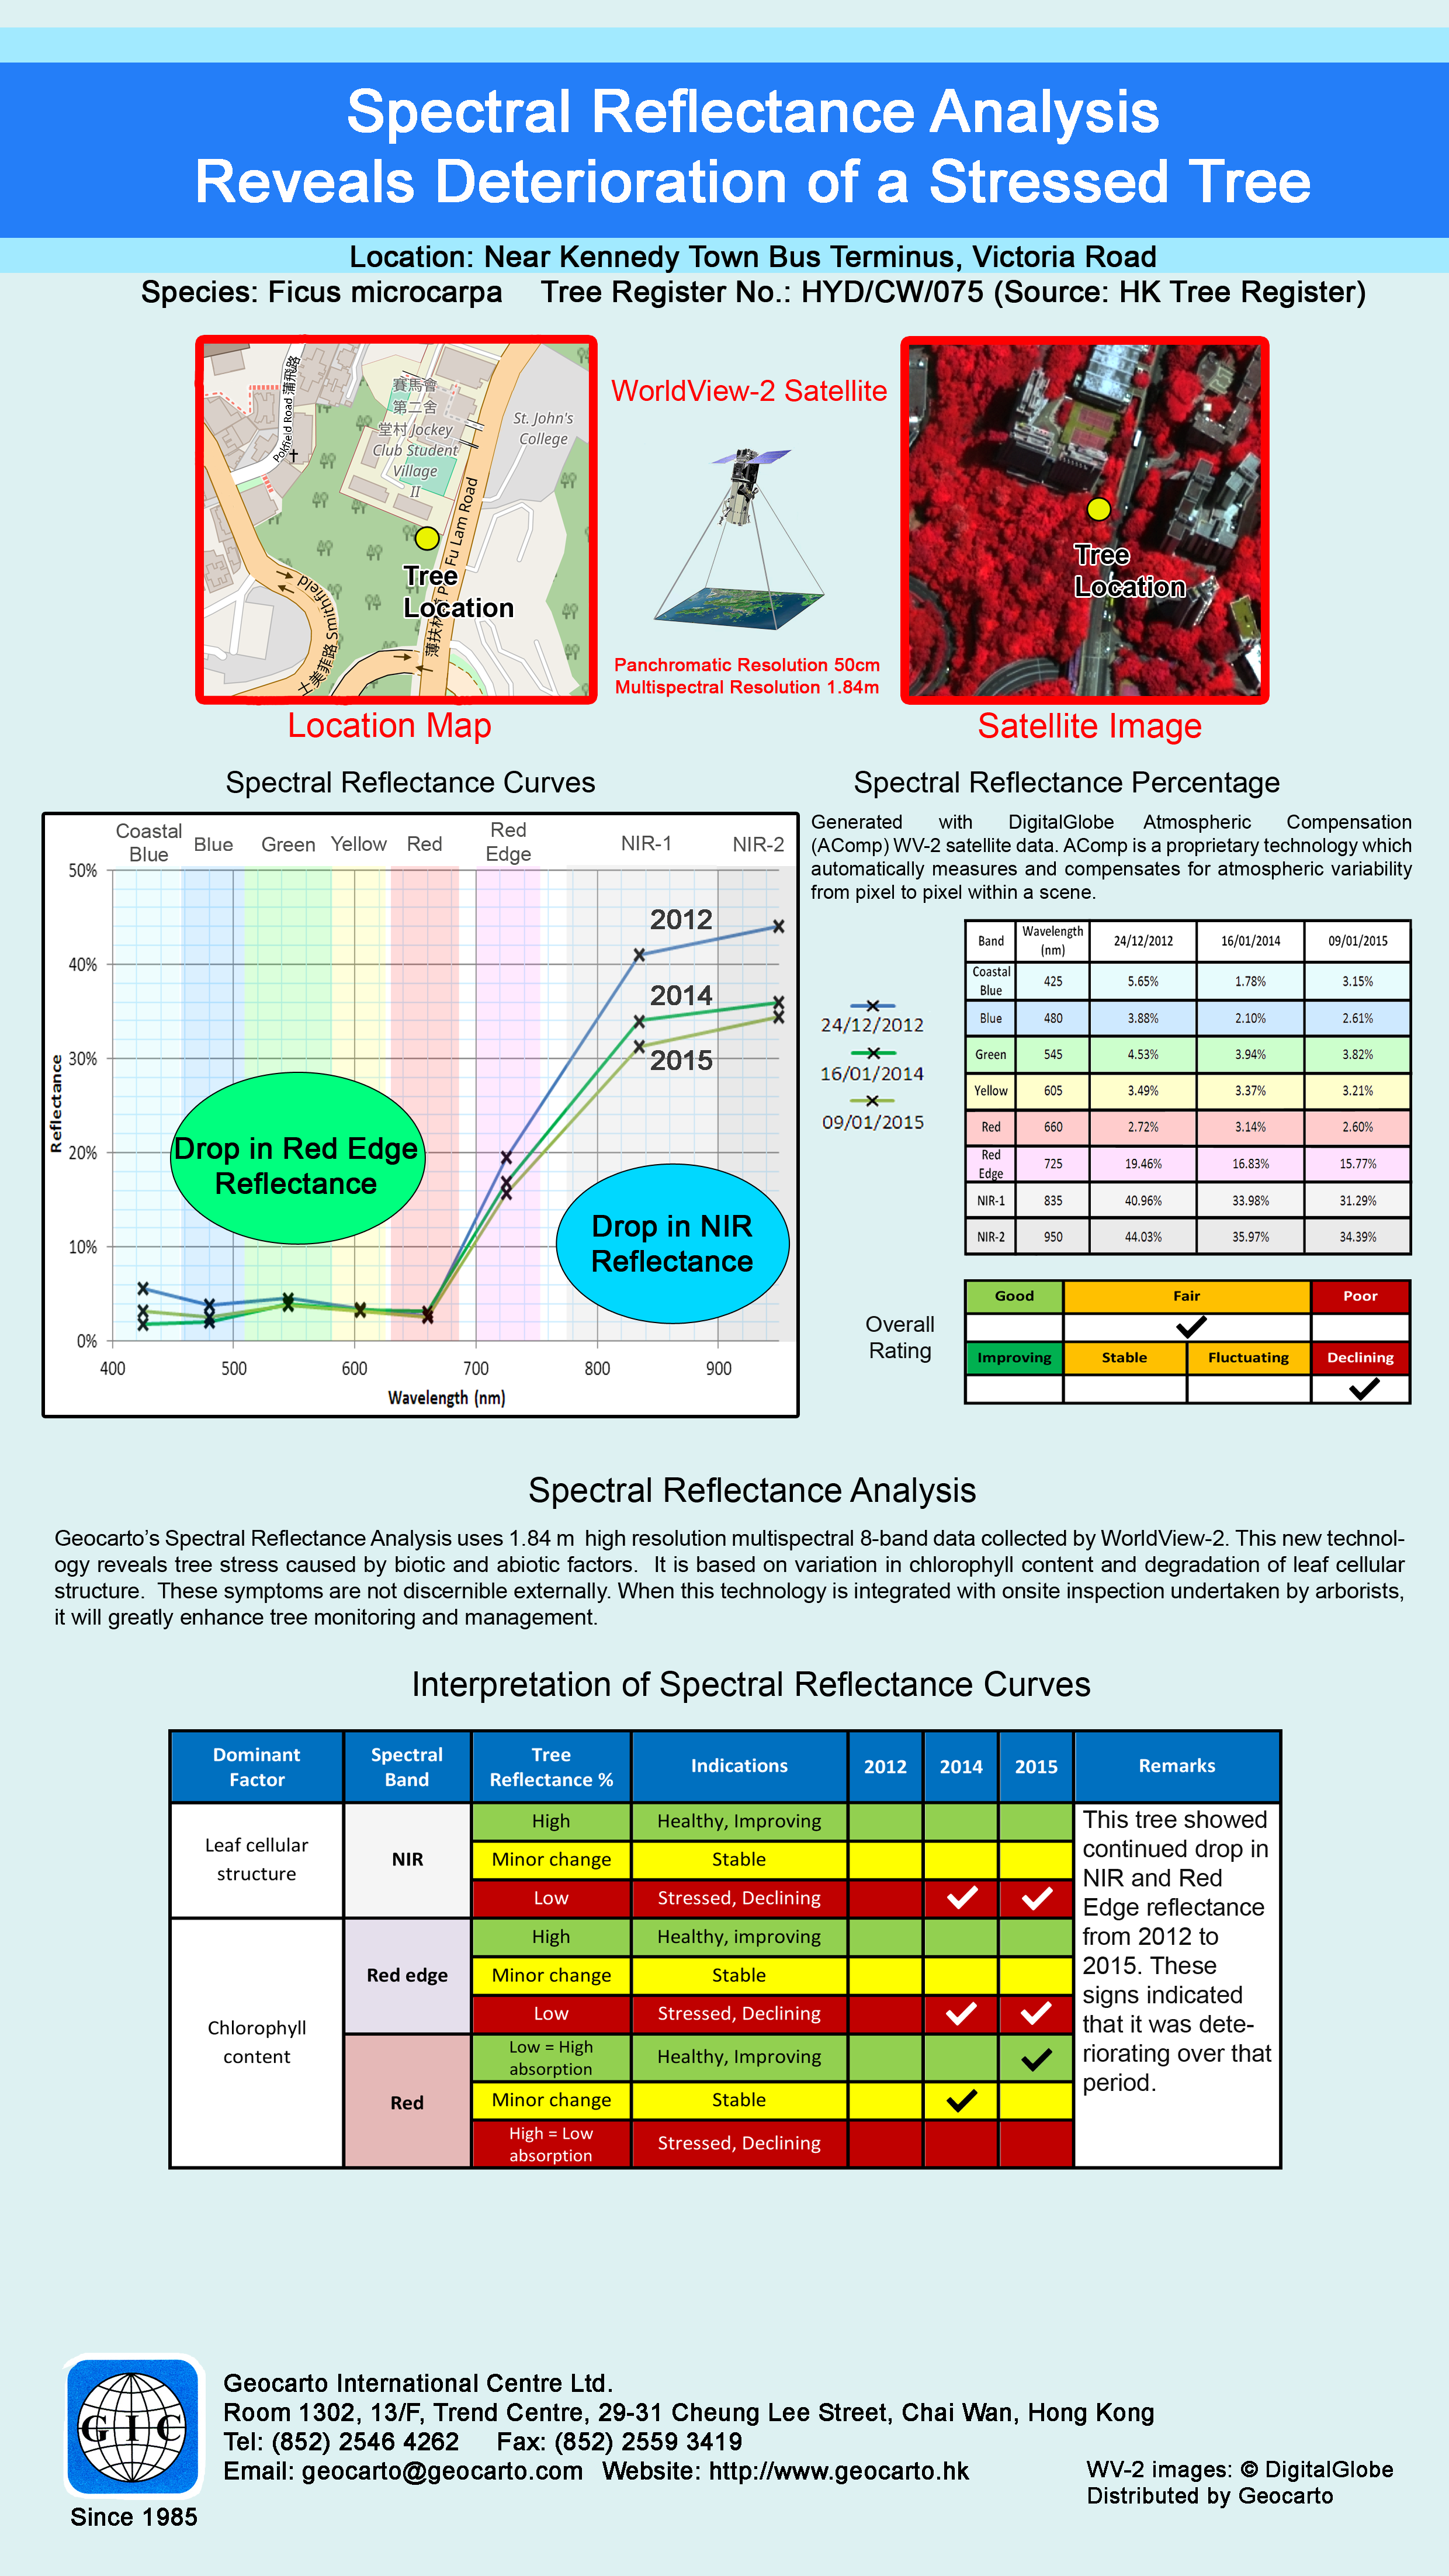 Chart 26What warning signs are revealed? | 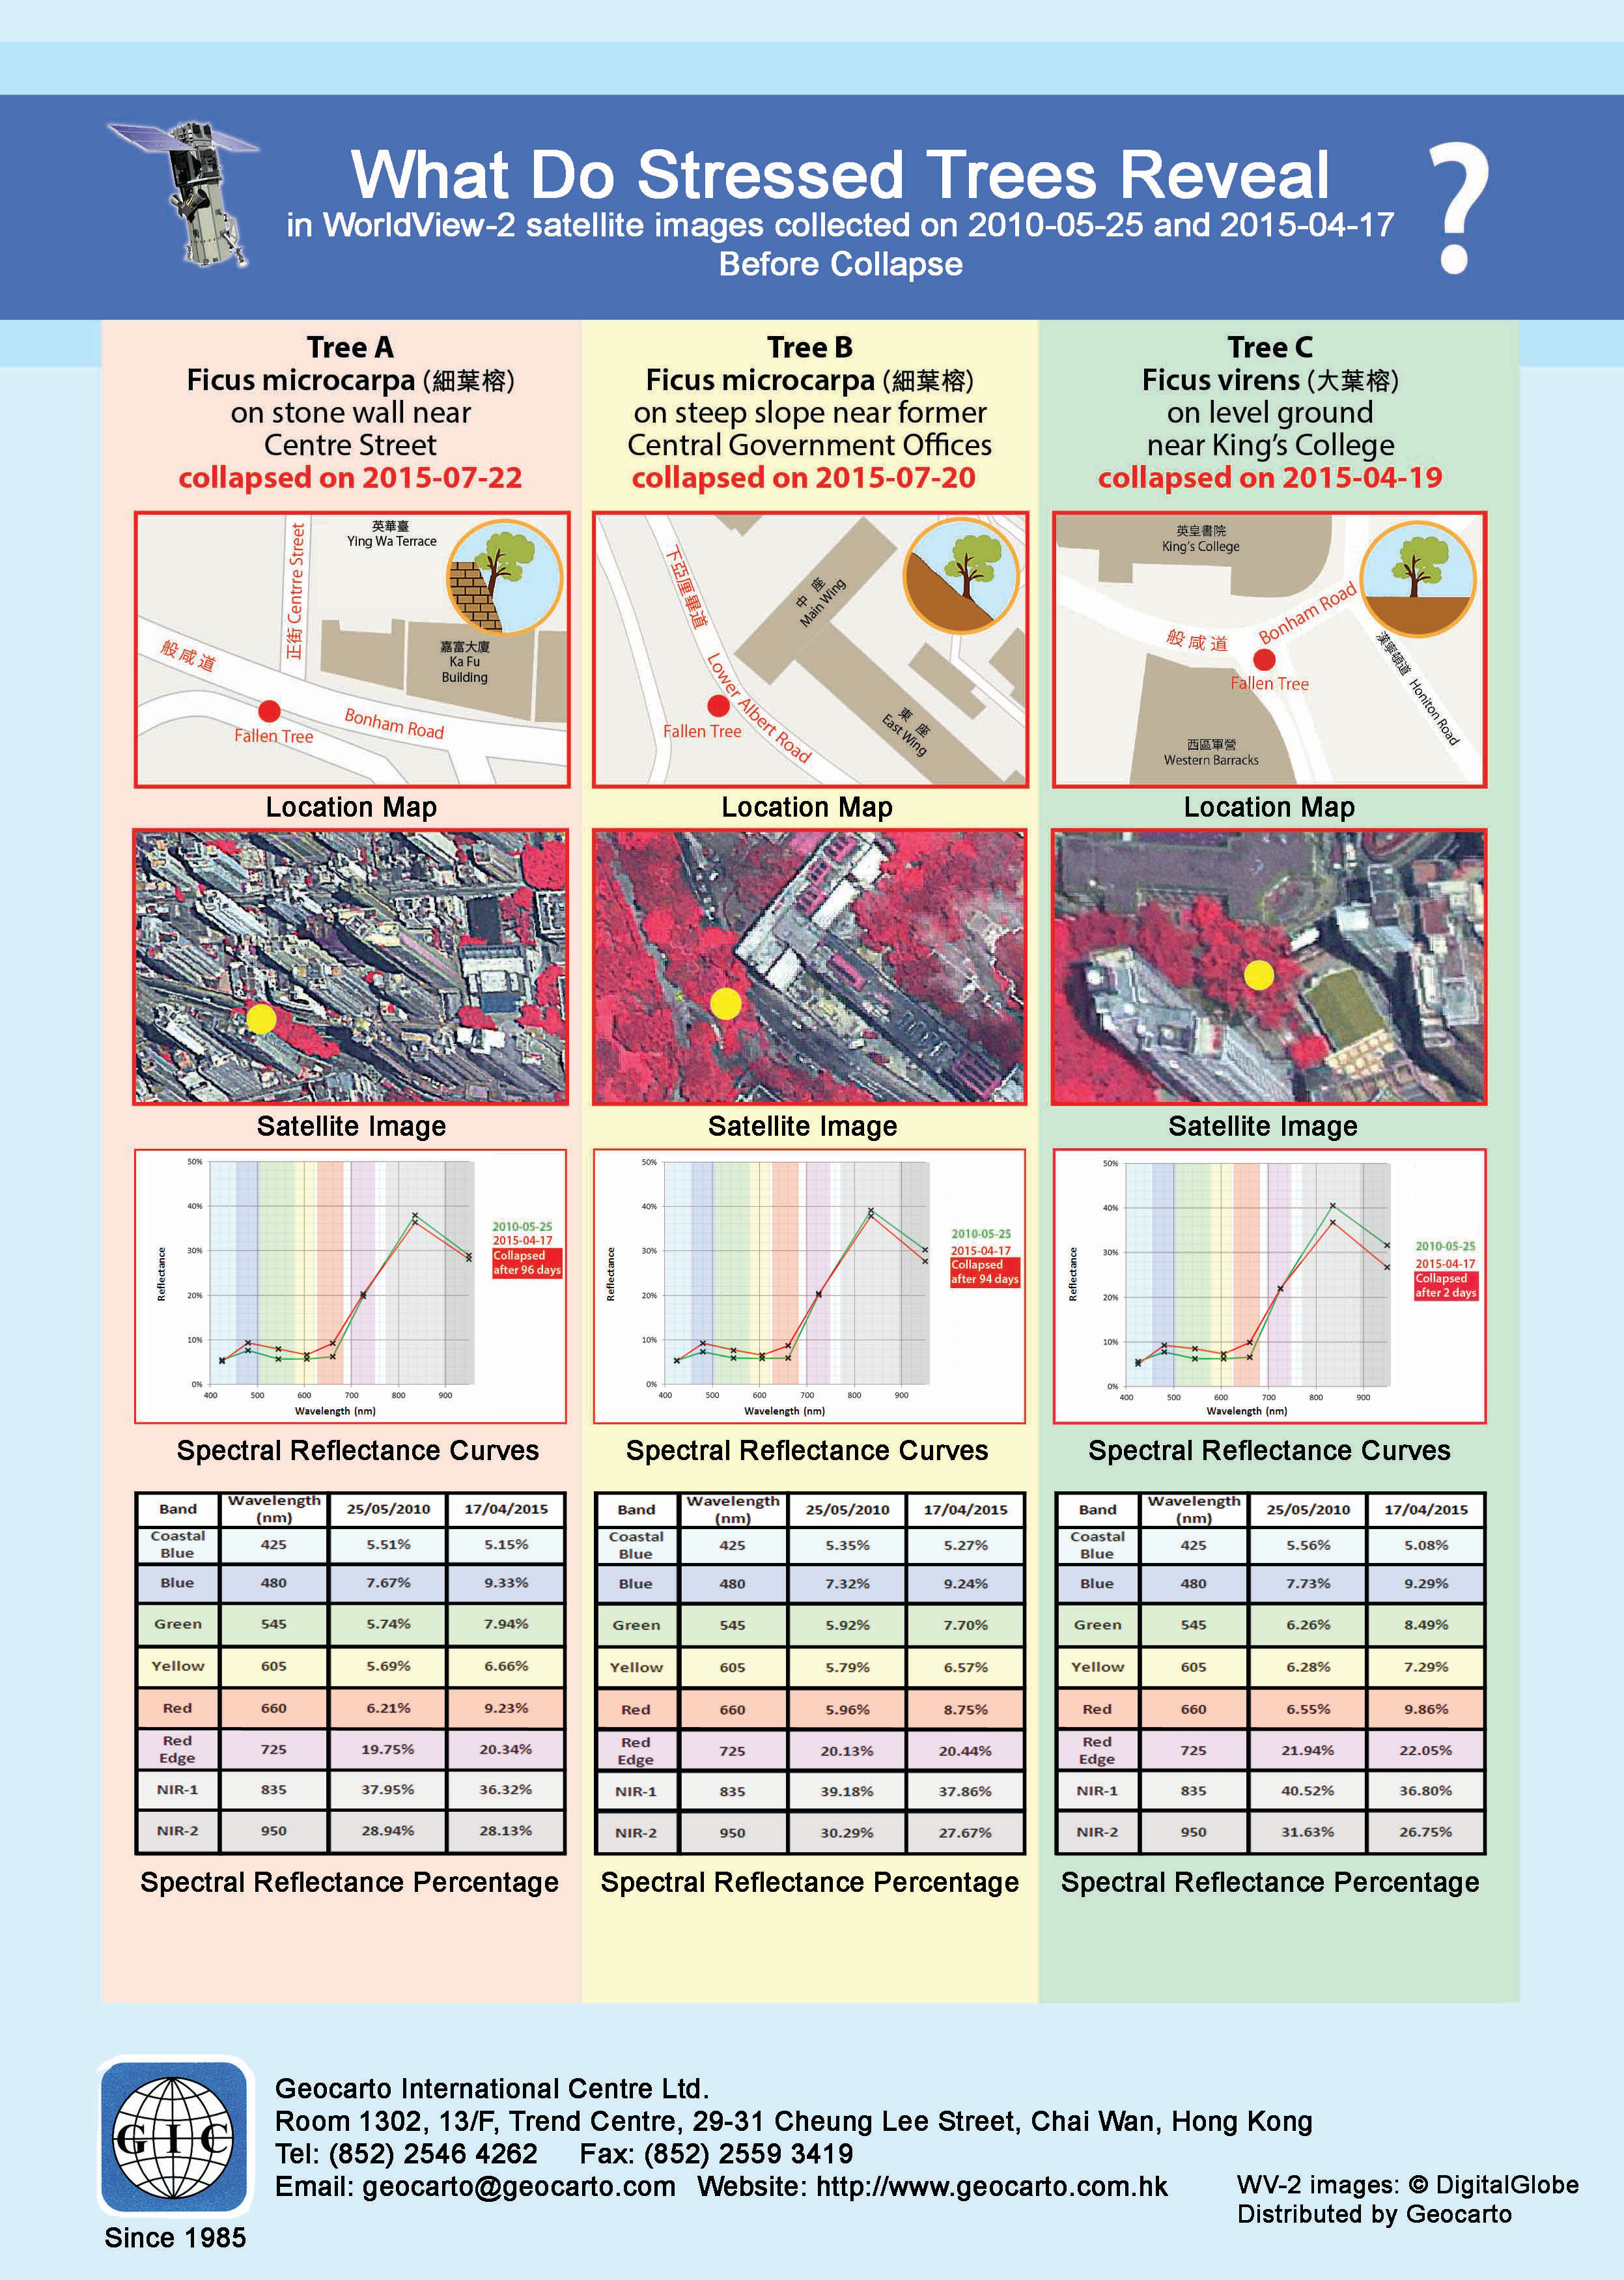 Chart 27What do Stressed Trees reveal before Collapse |
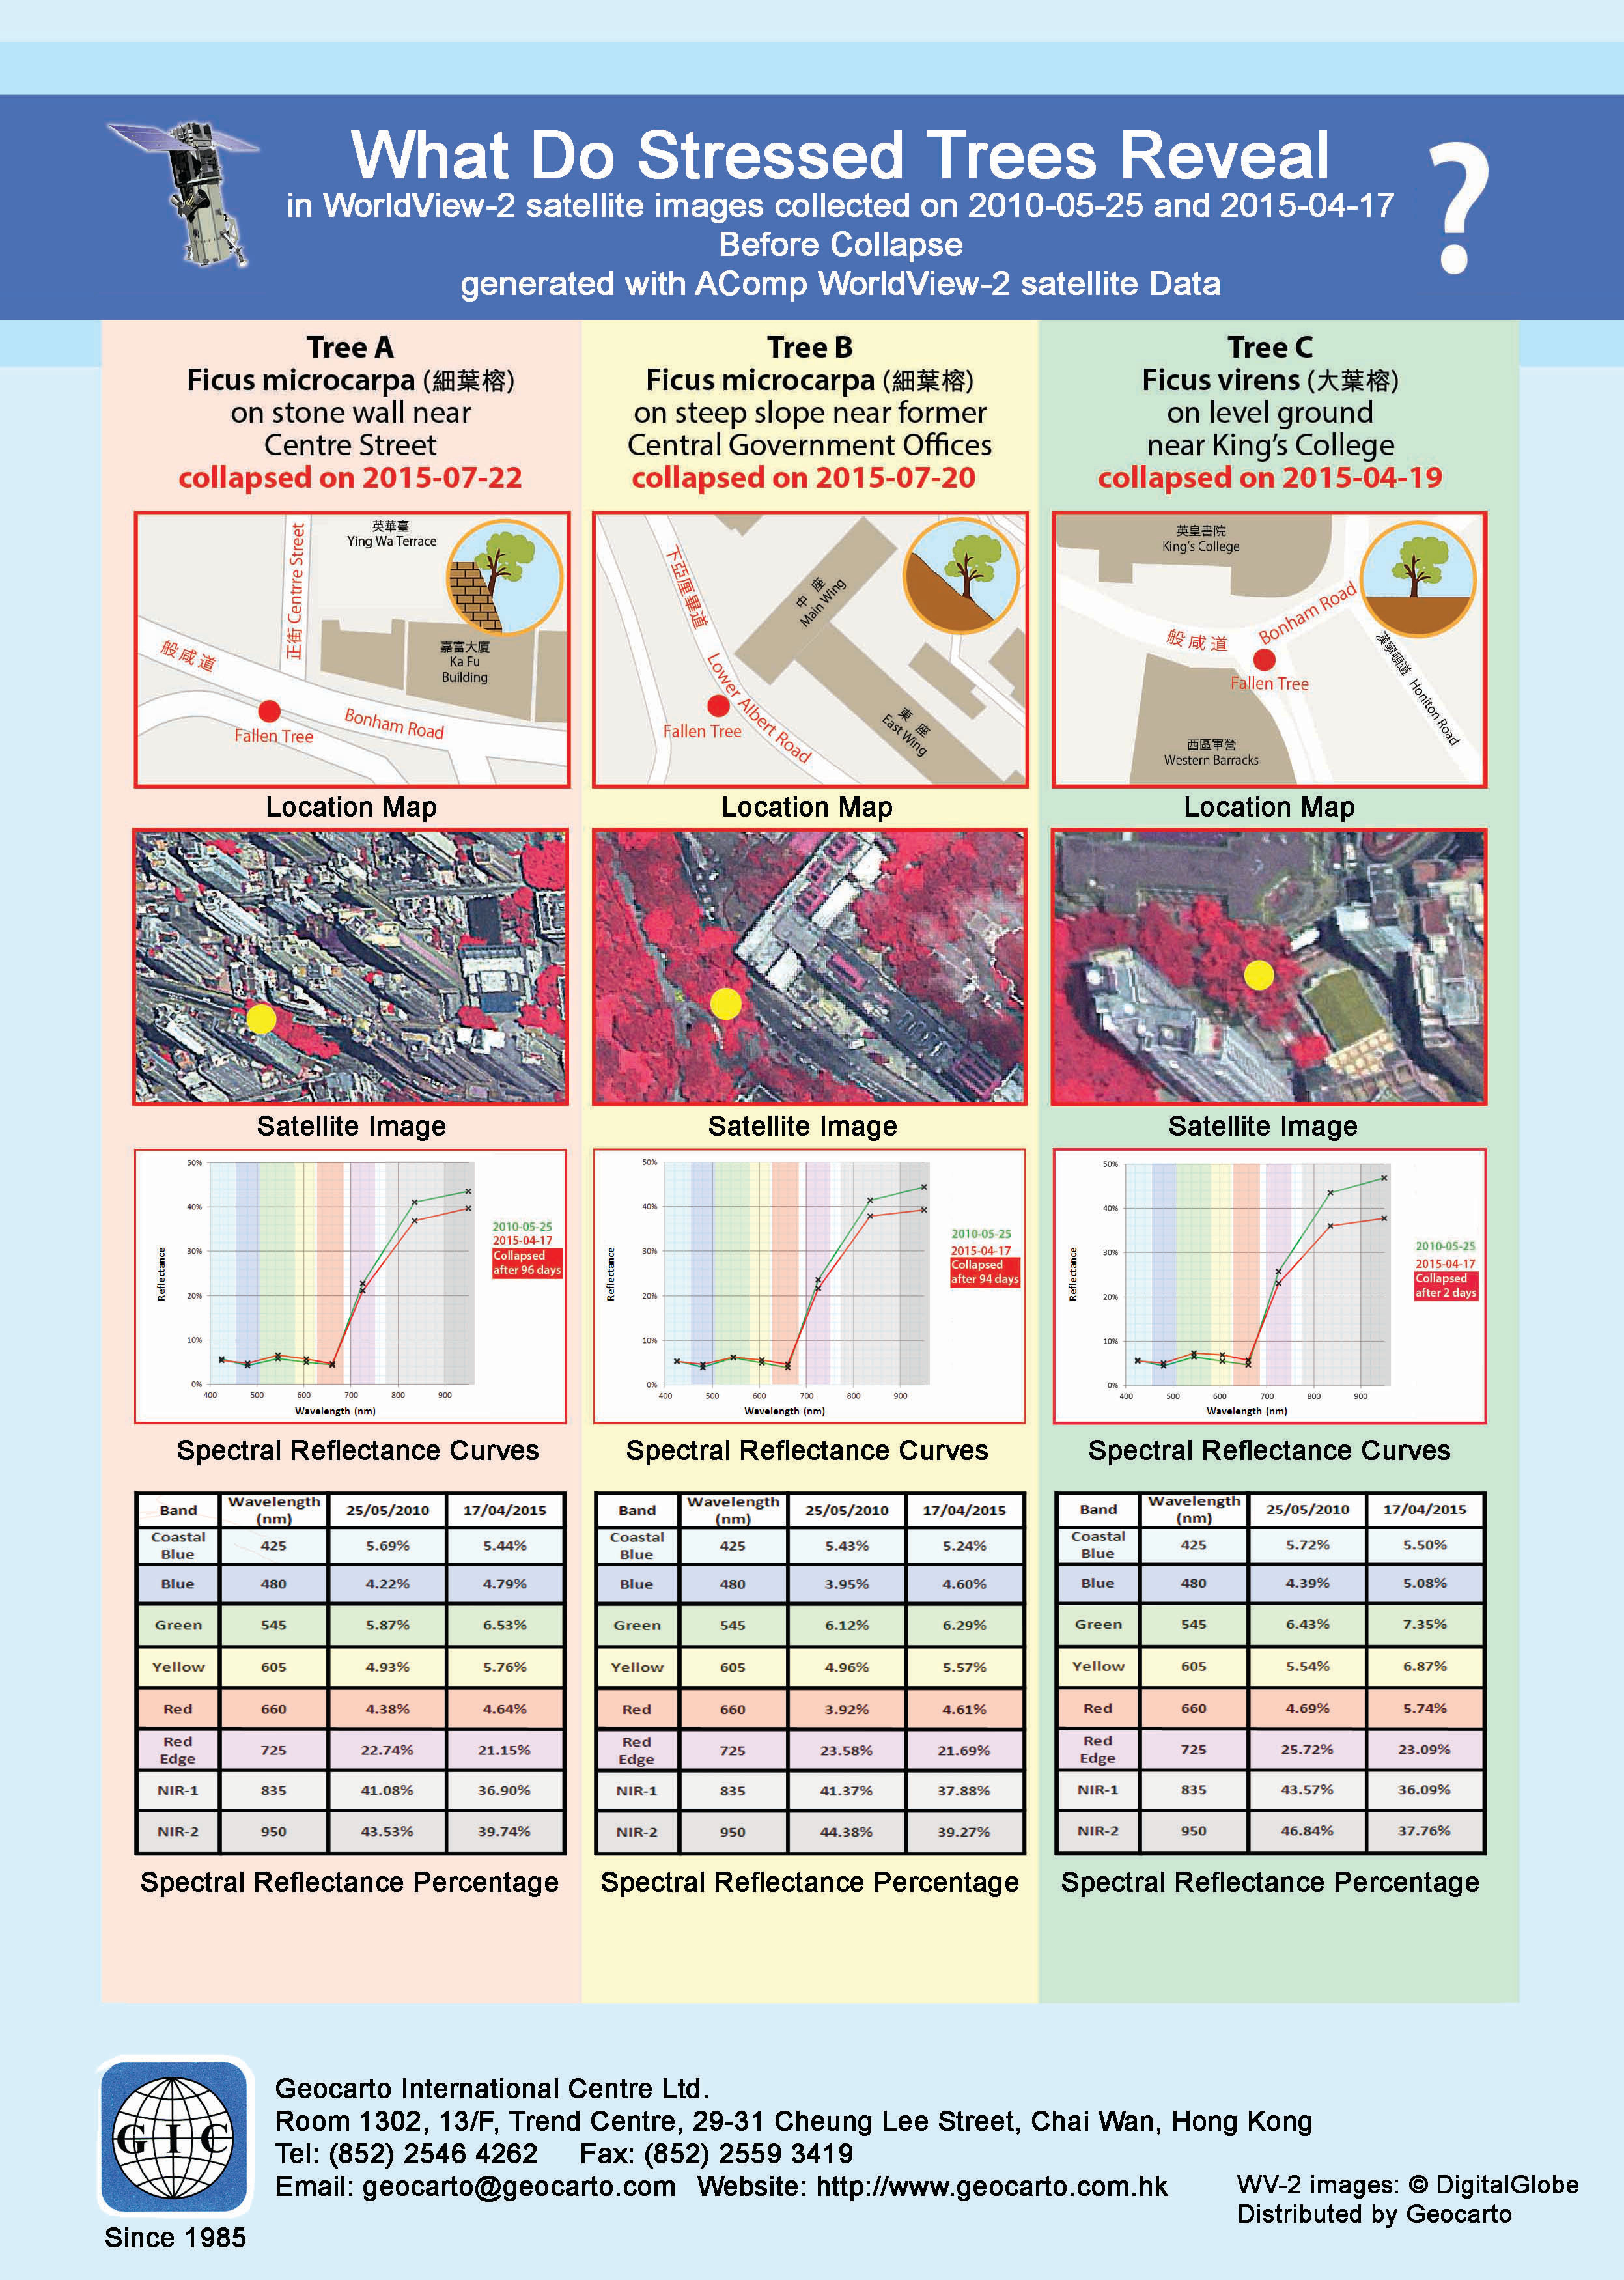 Chart 28What do Stressed Trees reveal before Collapse generated with AComp Data | 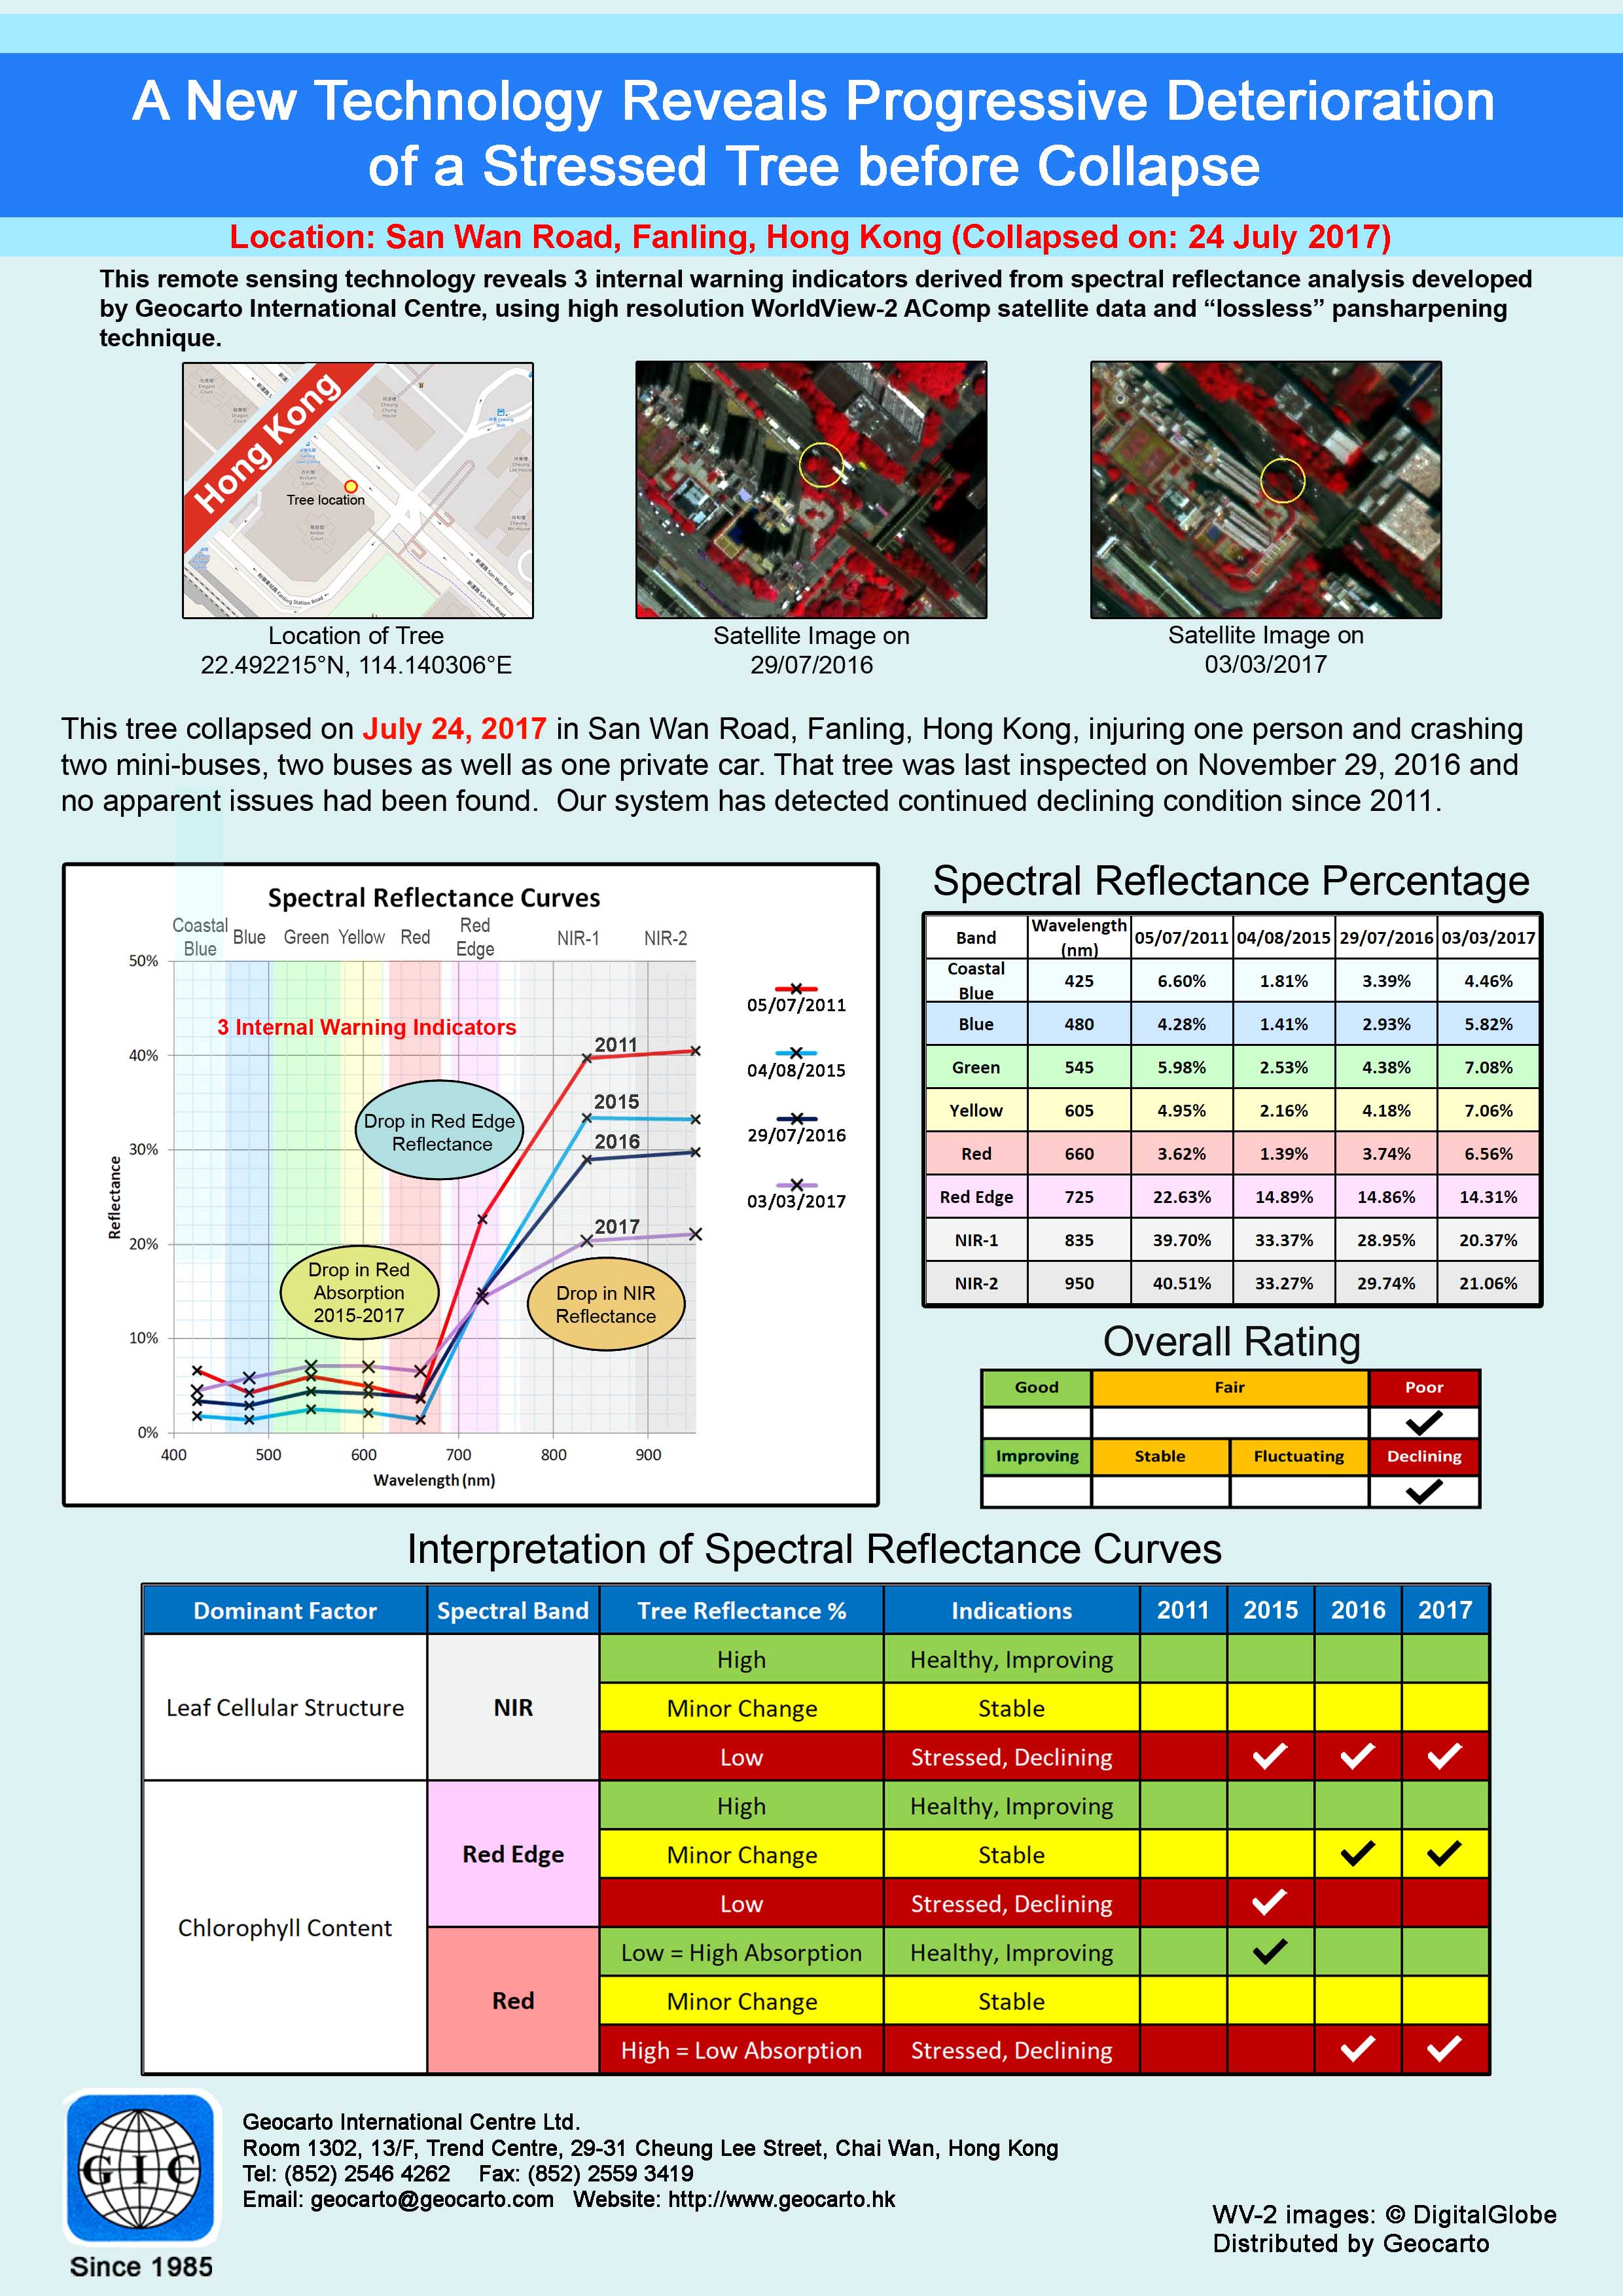 Chart 29Collapsed tree in Fanling | 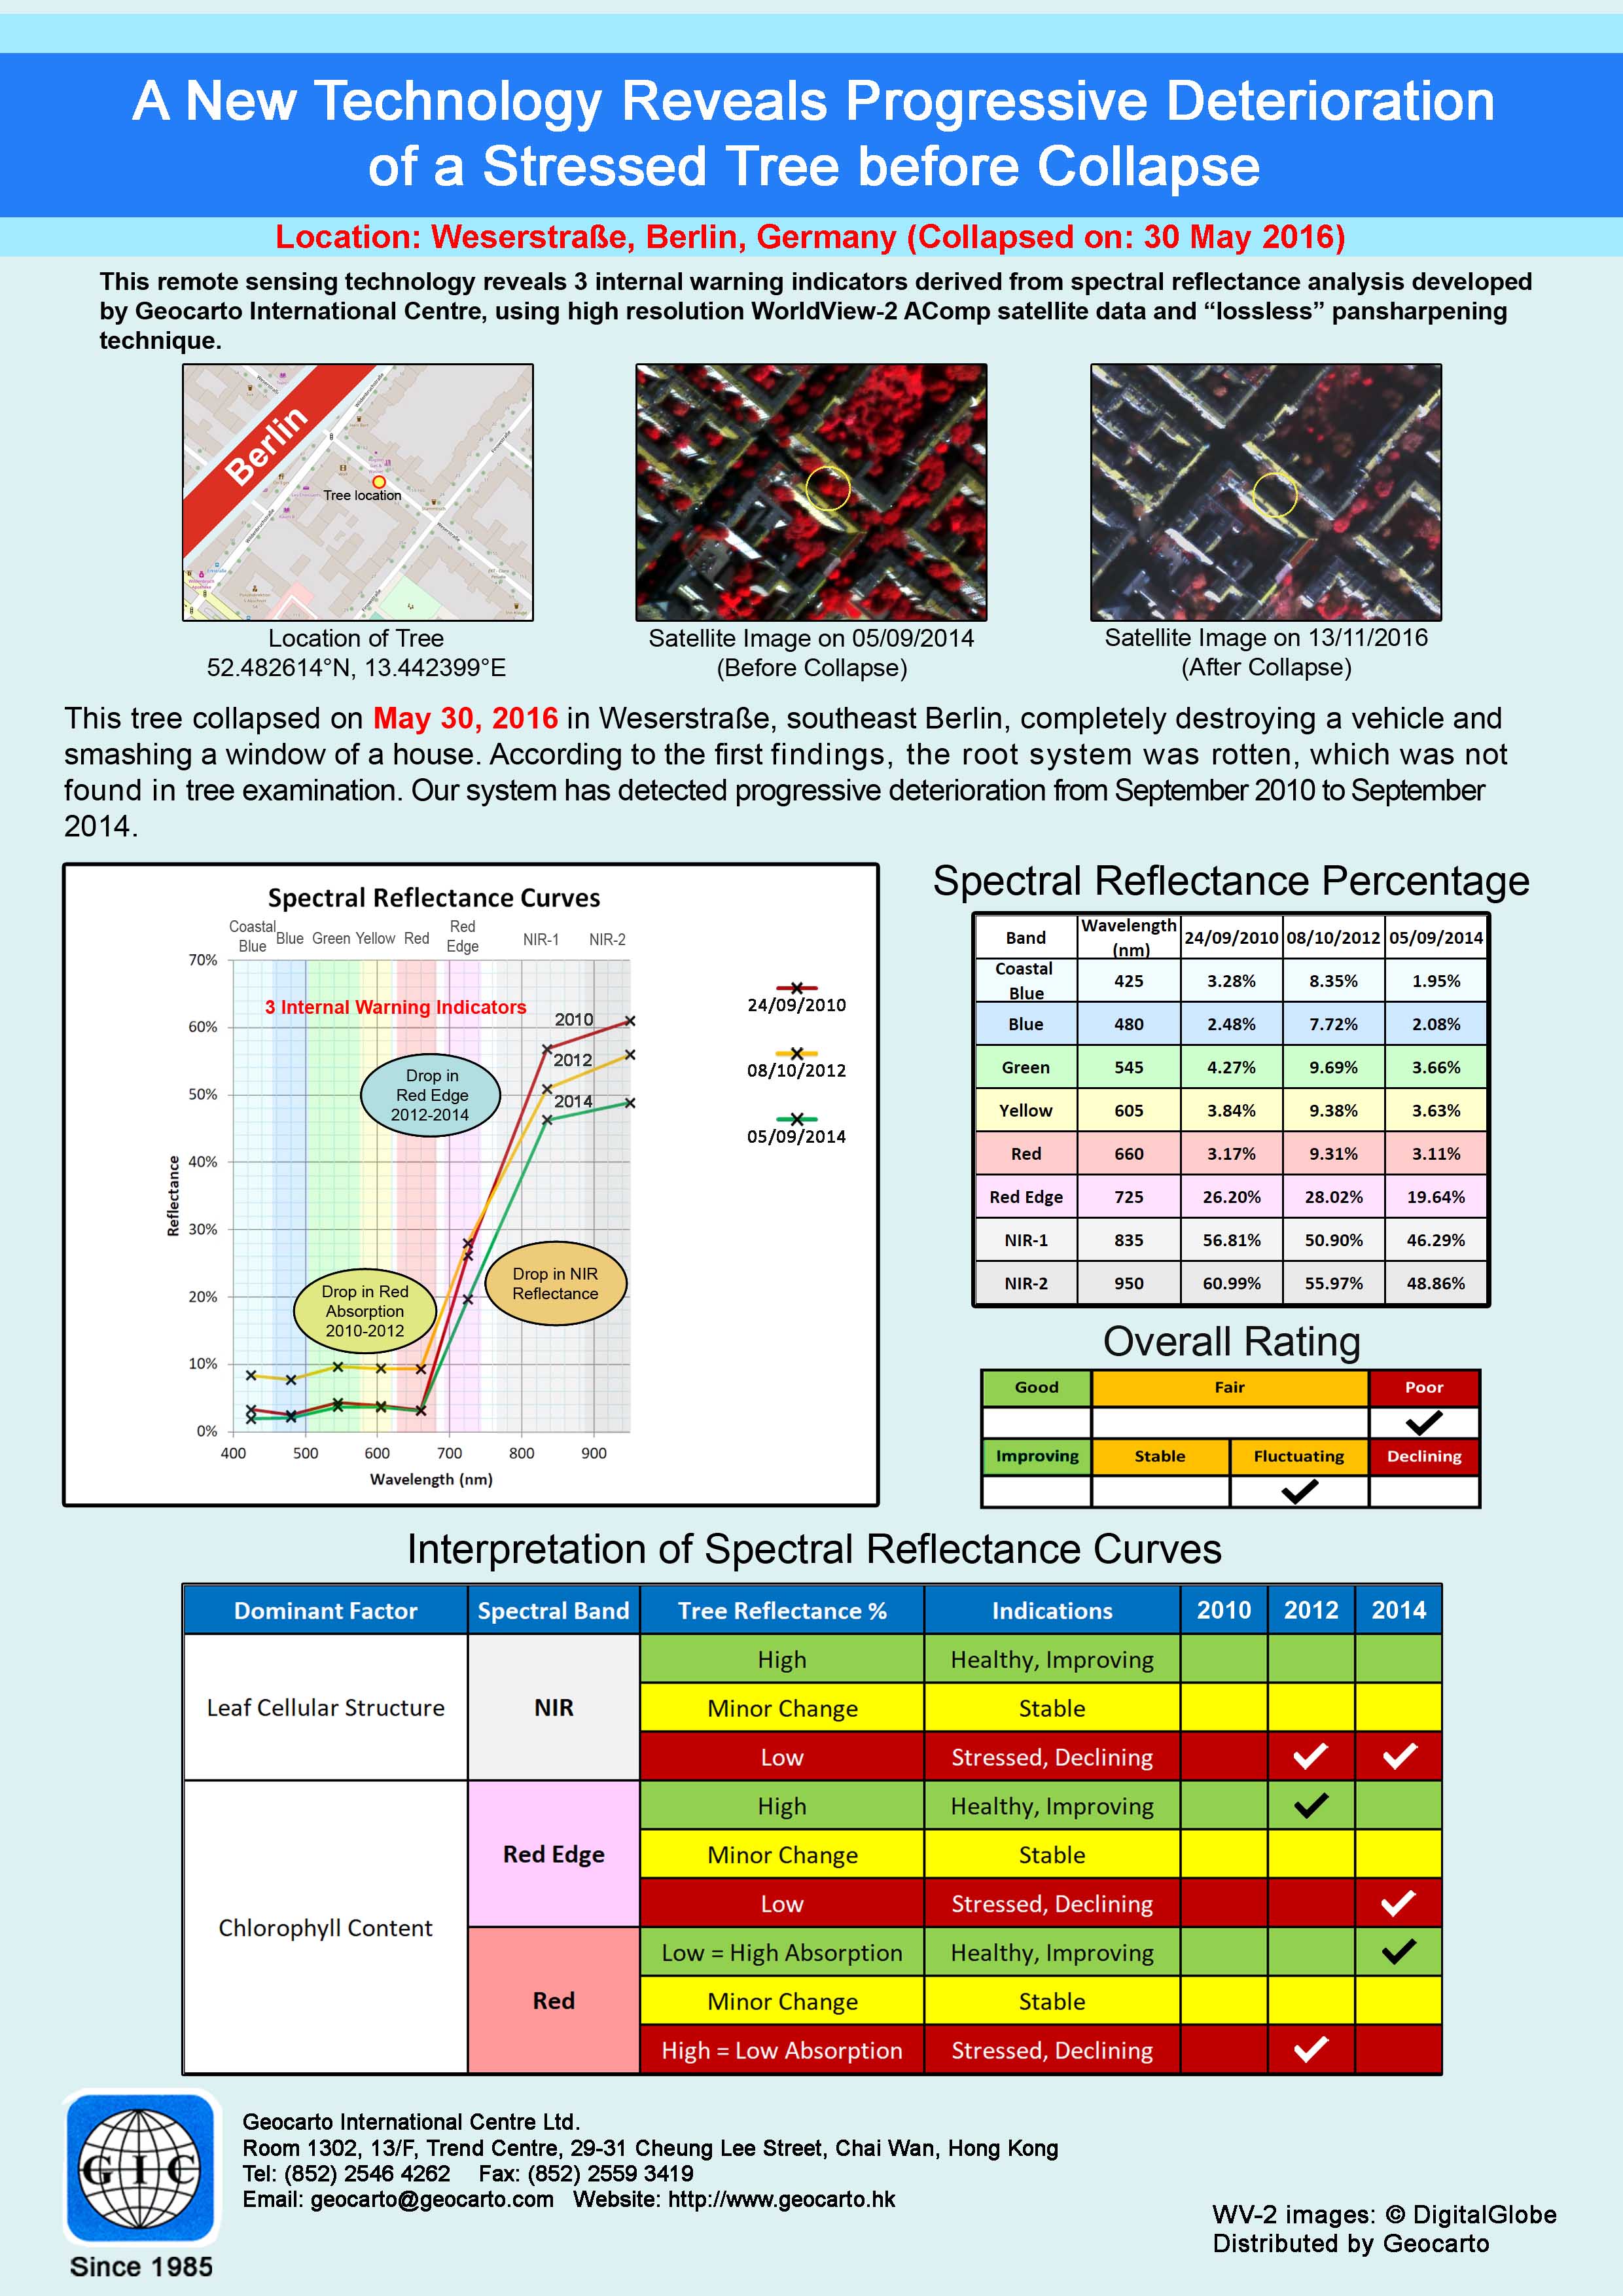 Chart 30Collapsed tree in Berlin |
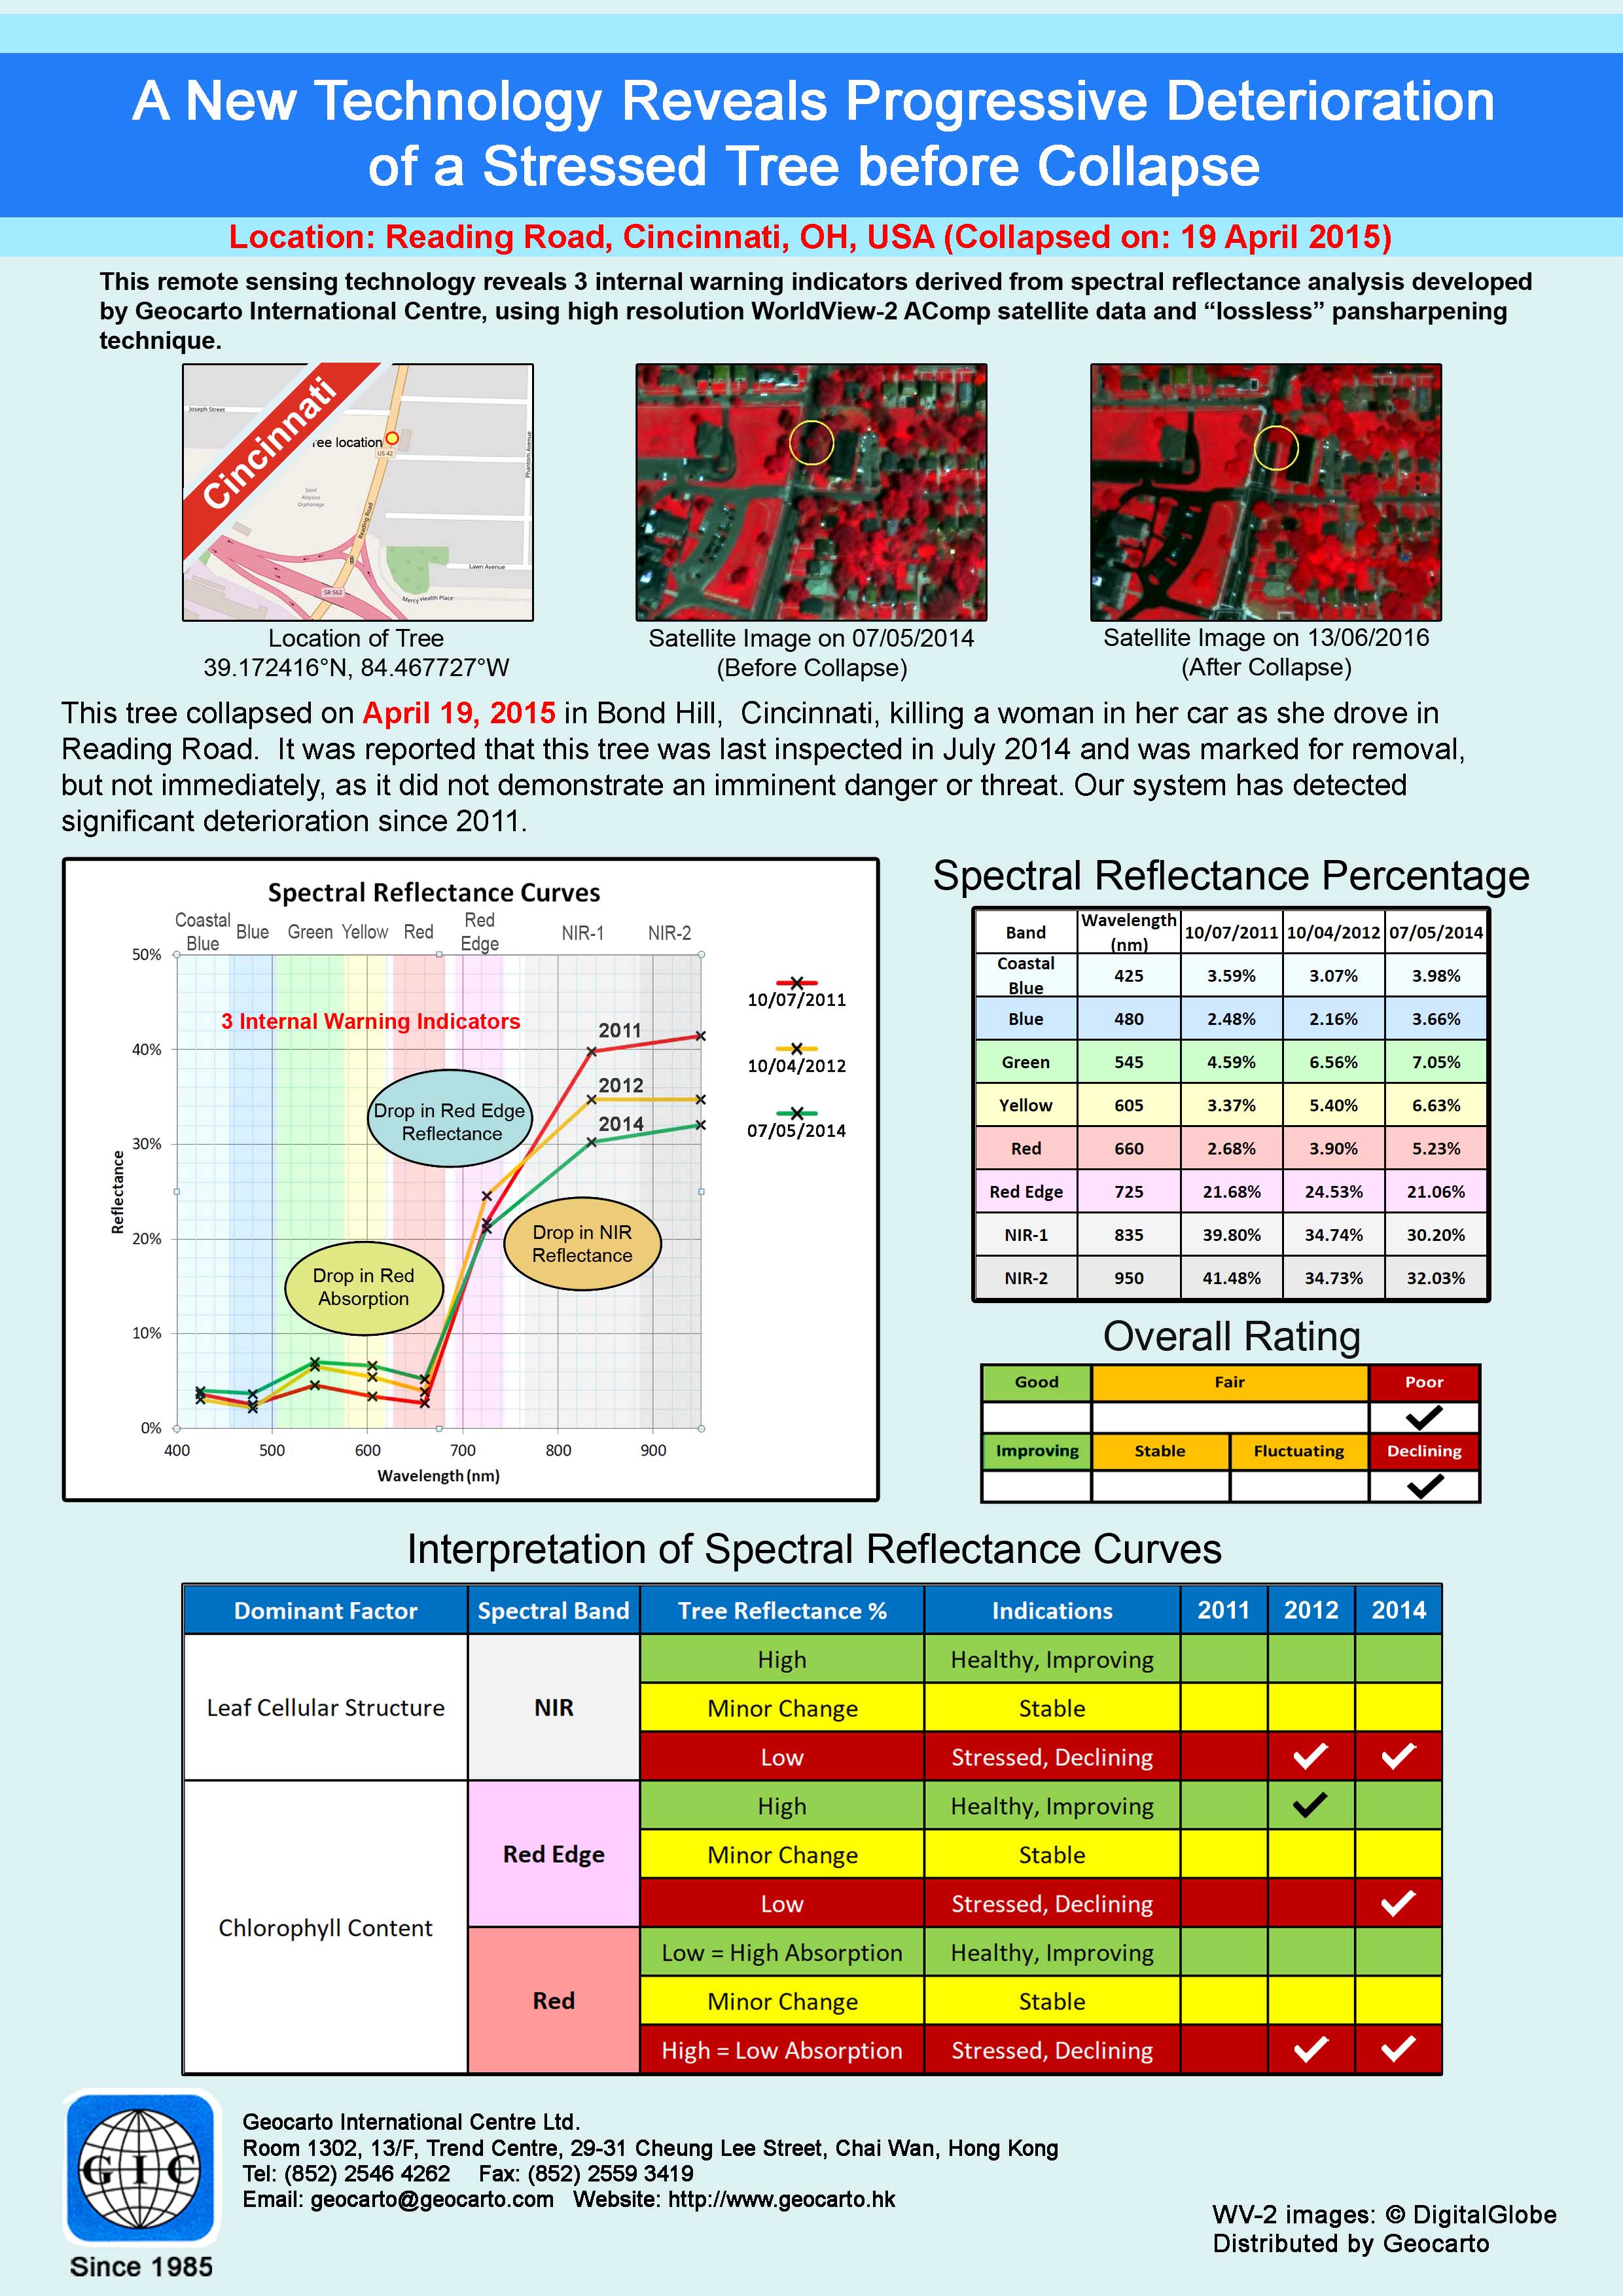 Chart 31Collapsed tree in Cincinnati | 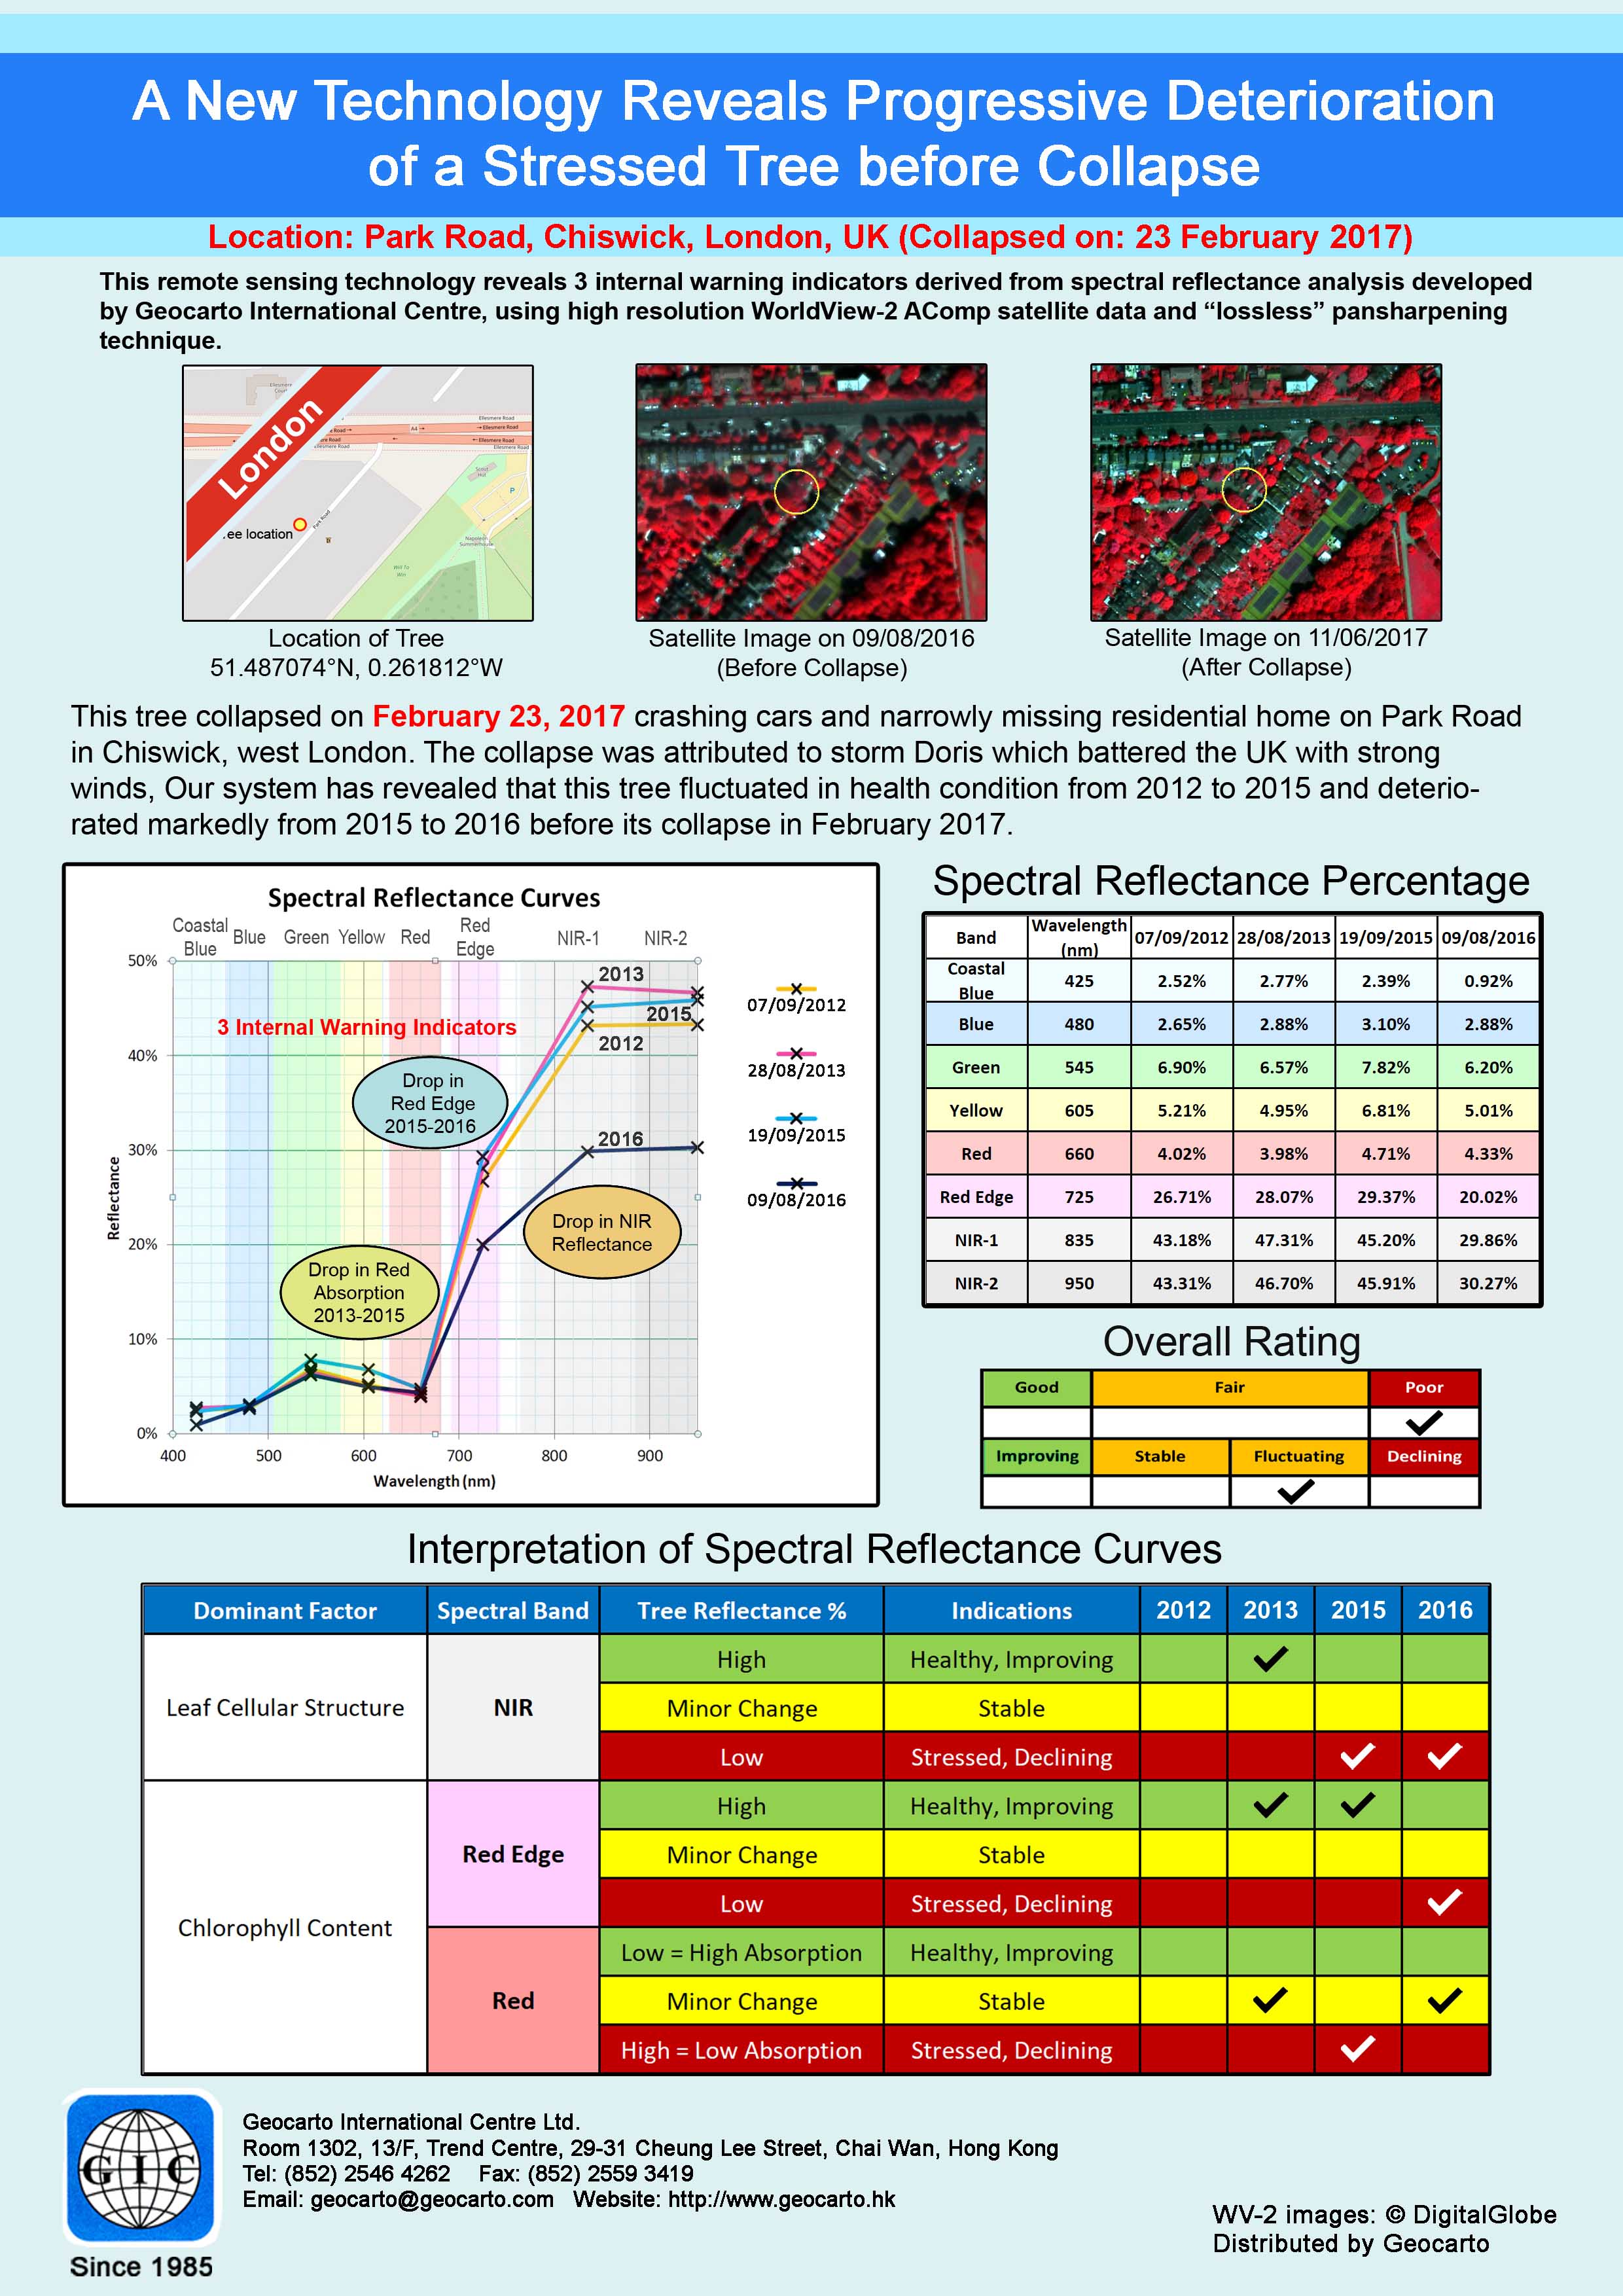 Chart 32Collapsed tree in Chiswick | 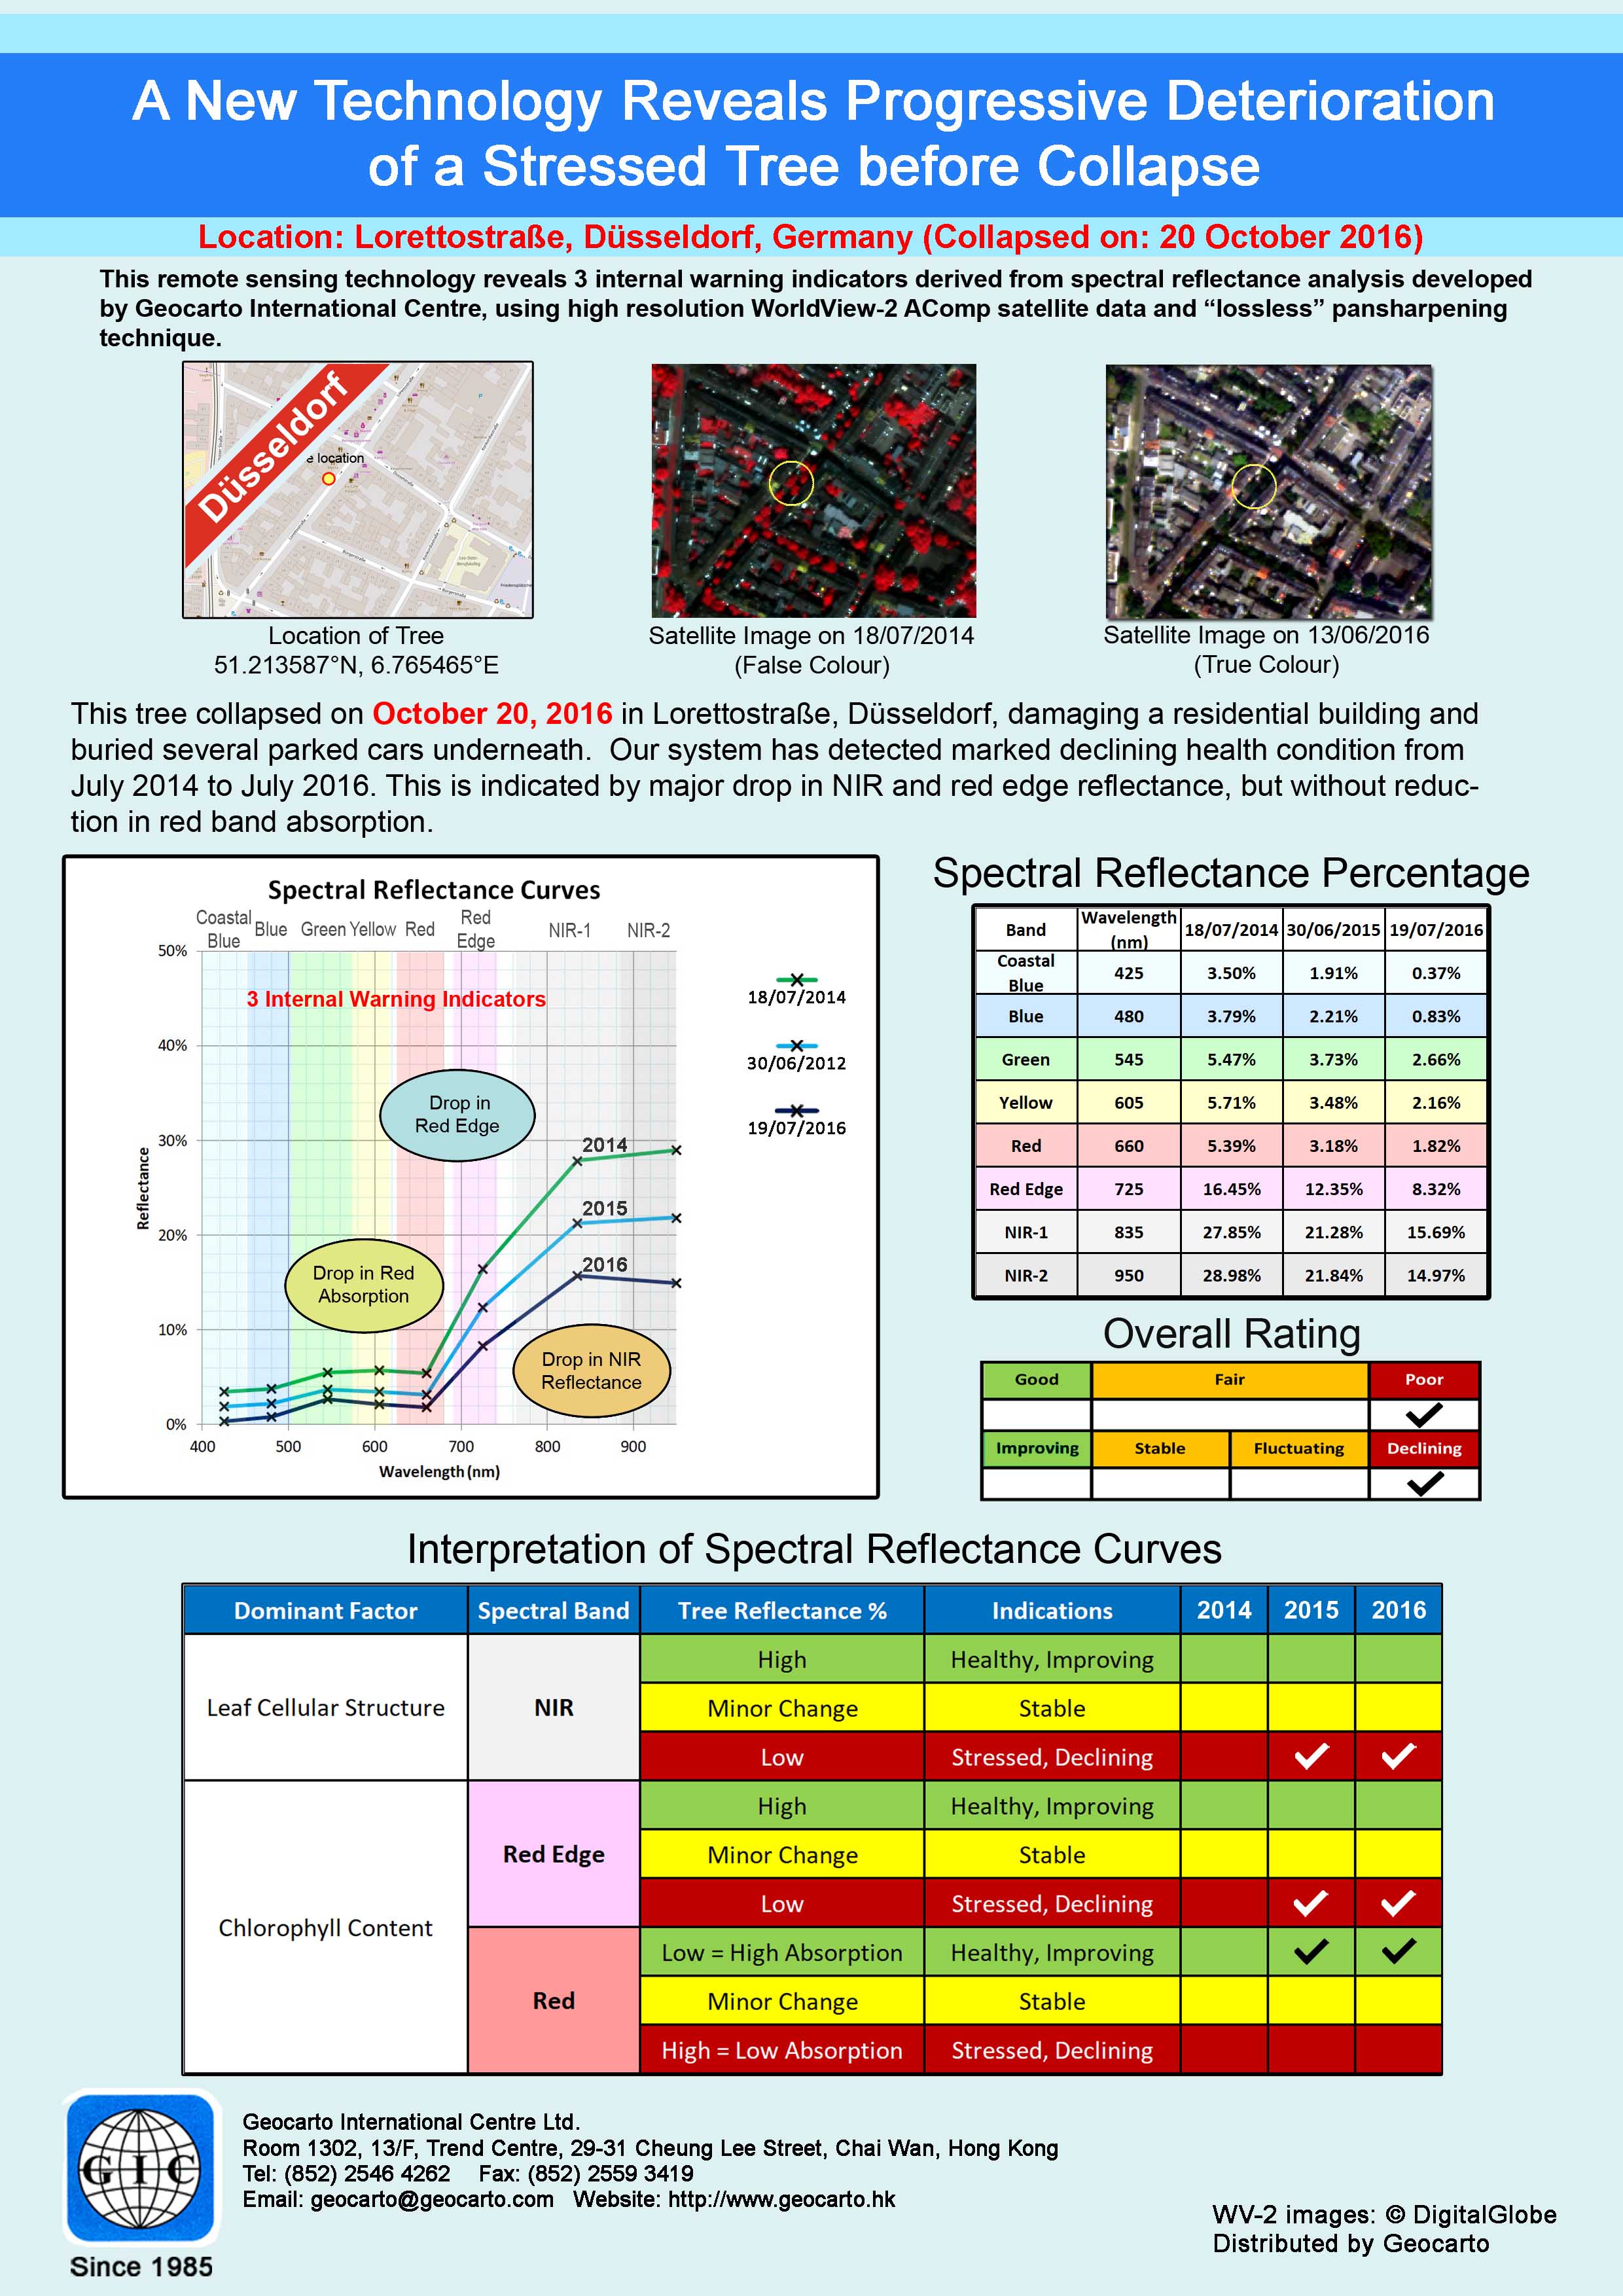 Chart 33Collapsed tree in Düsseldorf |
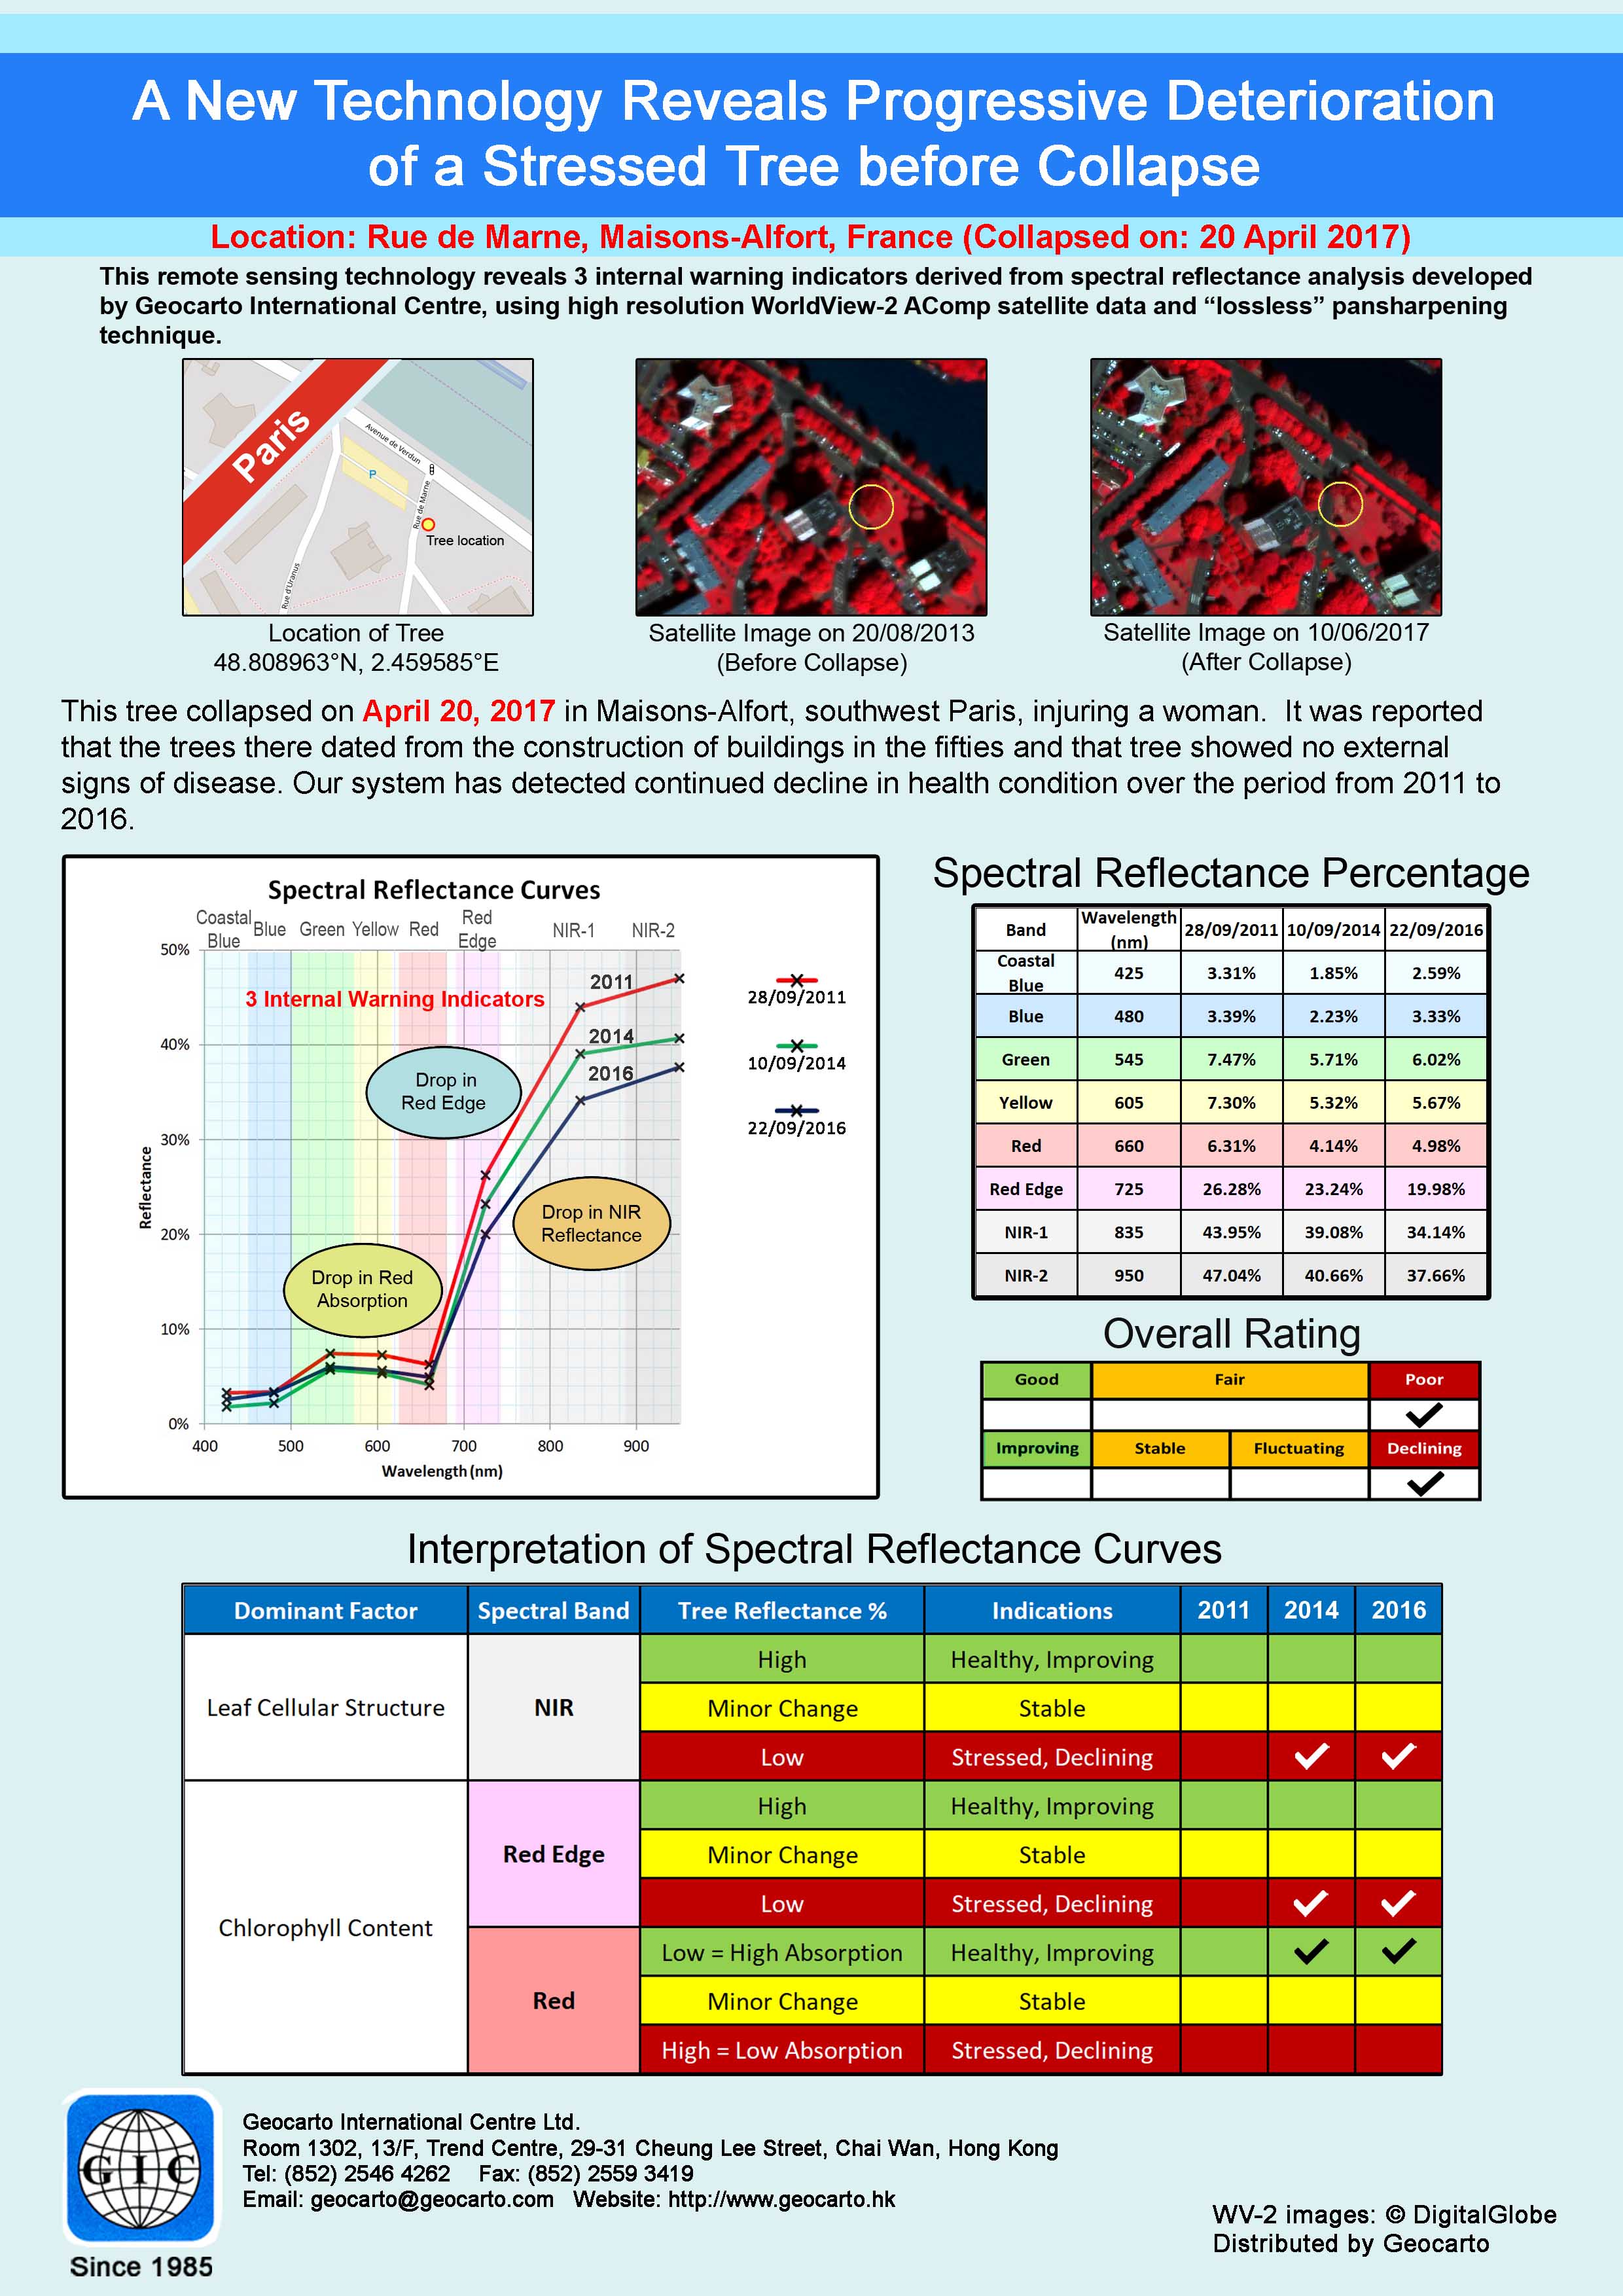 Chart 34Collapsed tree in Maisons-Alfort |  Chart 35Collapsed tree in Singapore | 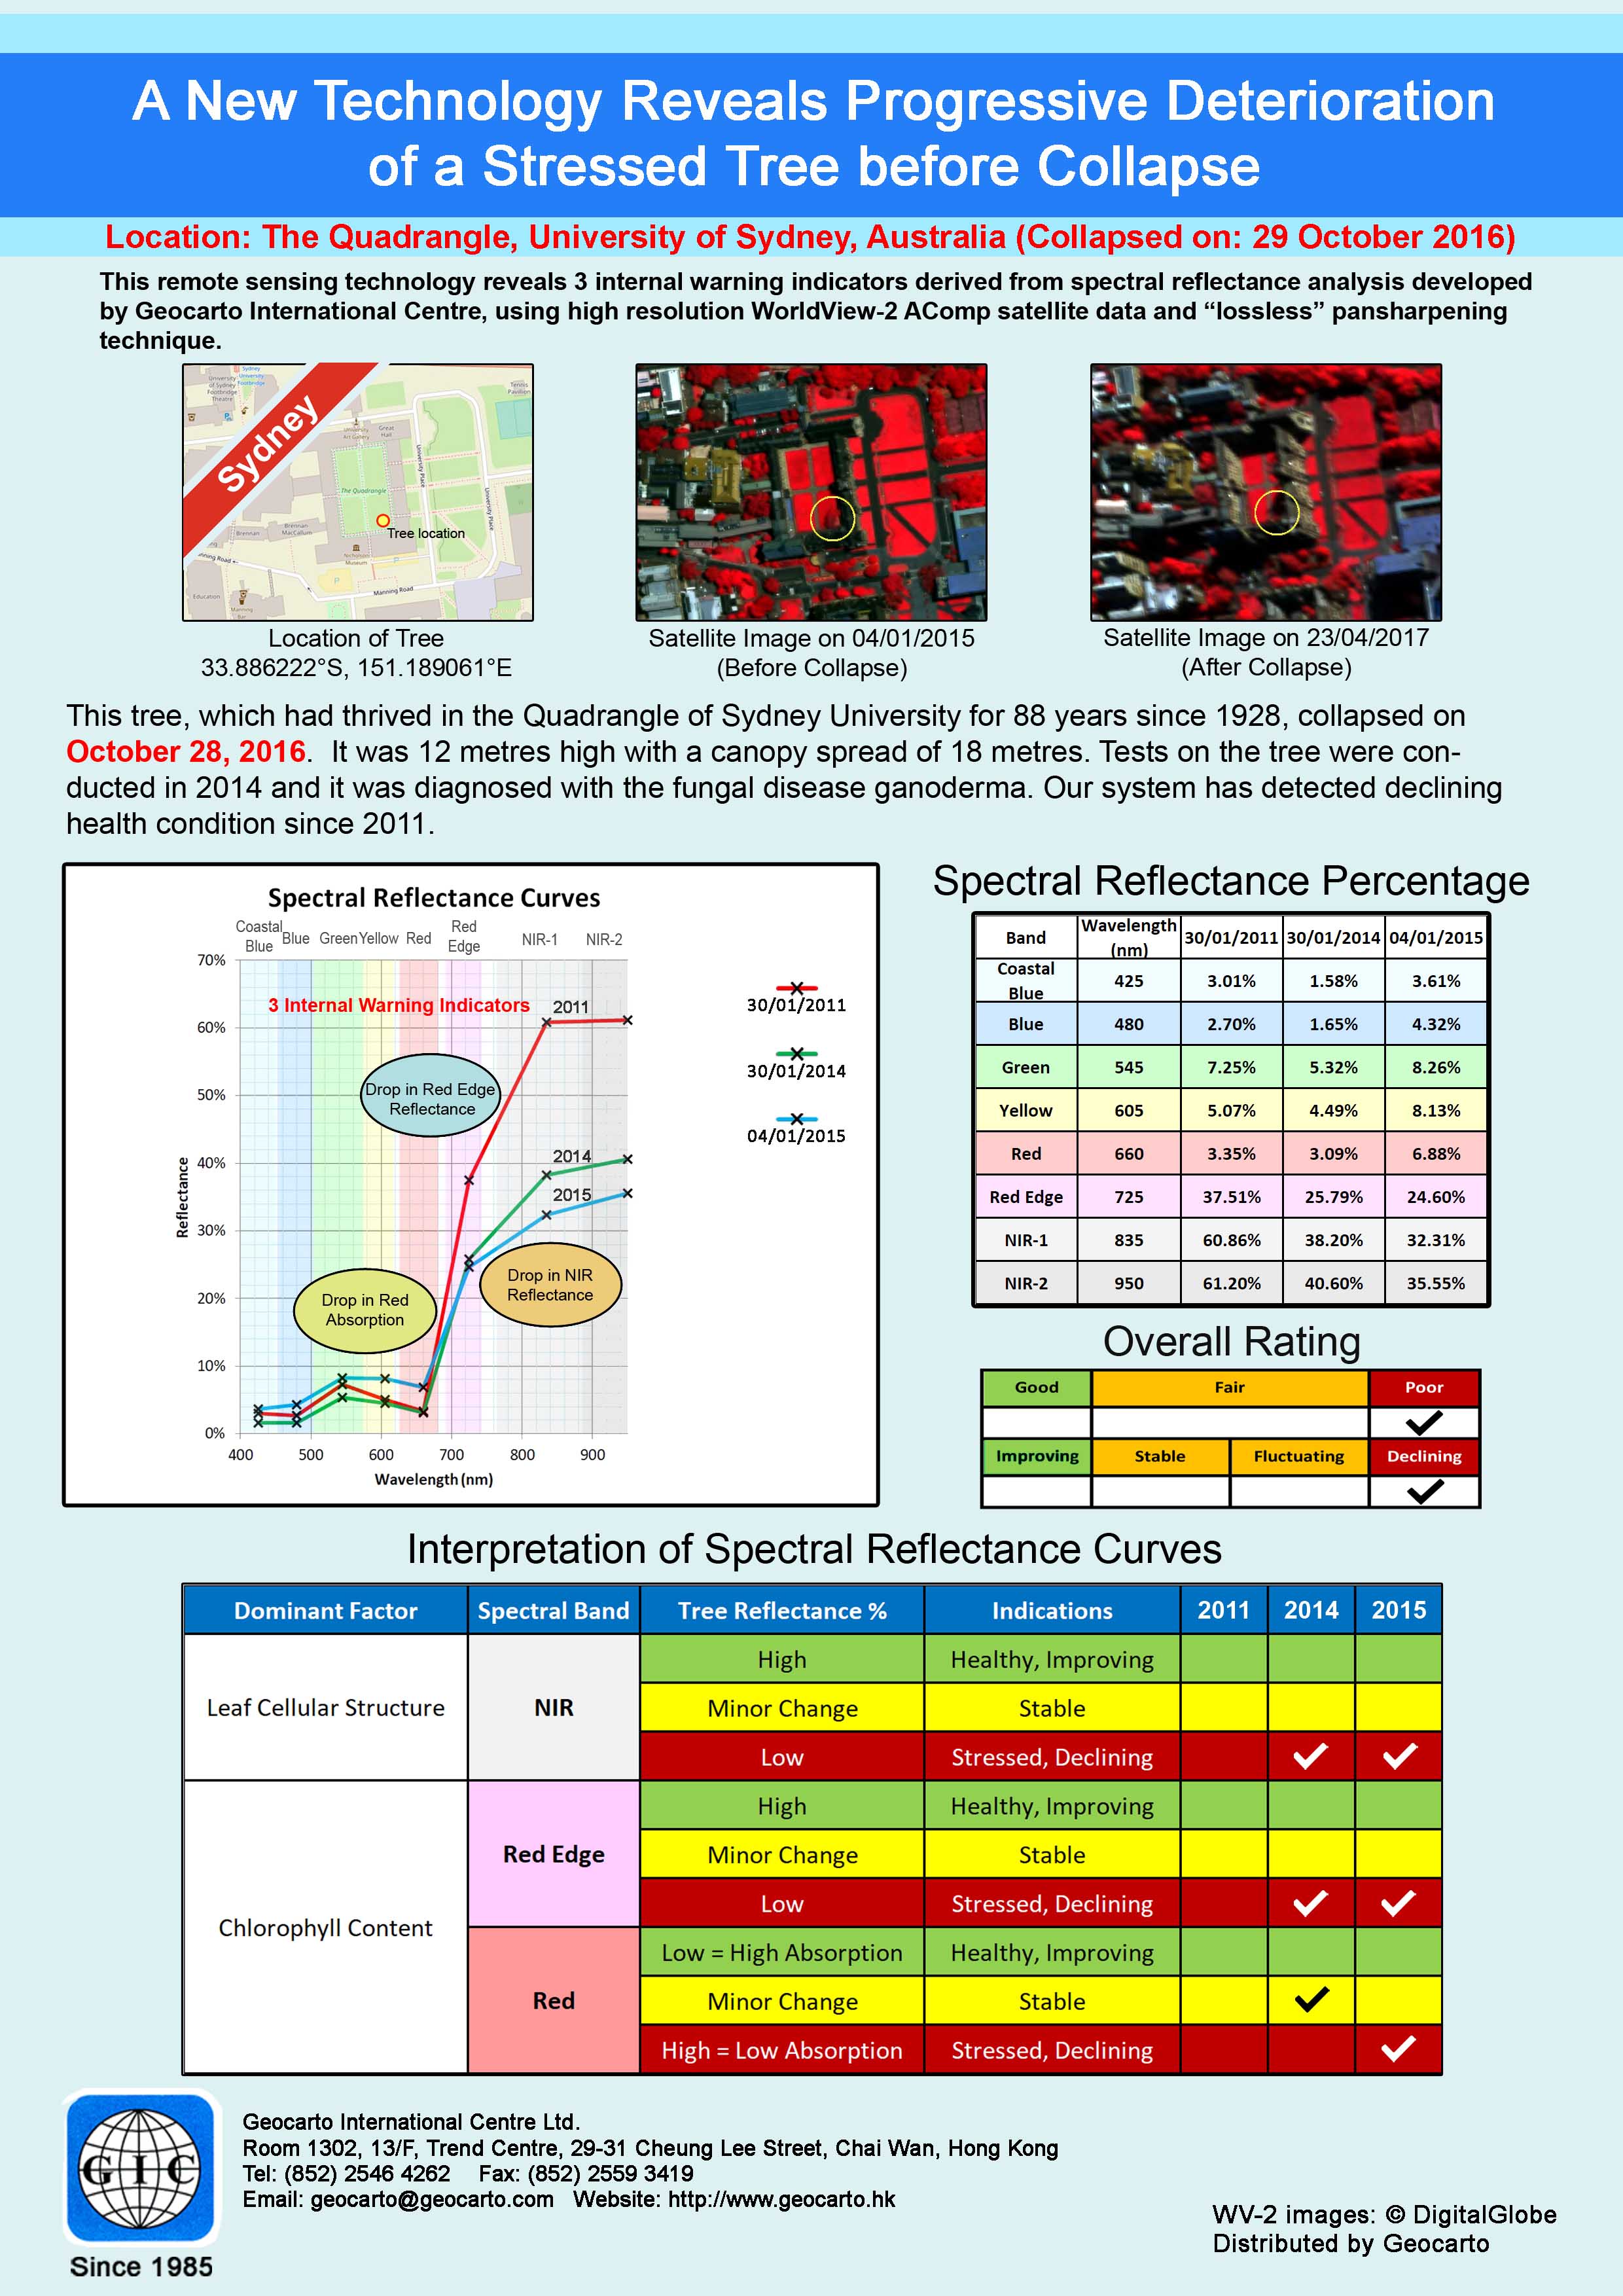 Chart 36Collapsed tree in Sydney |
 Chart 37Collapsed tree in Whittier | 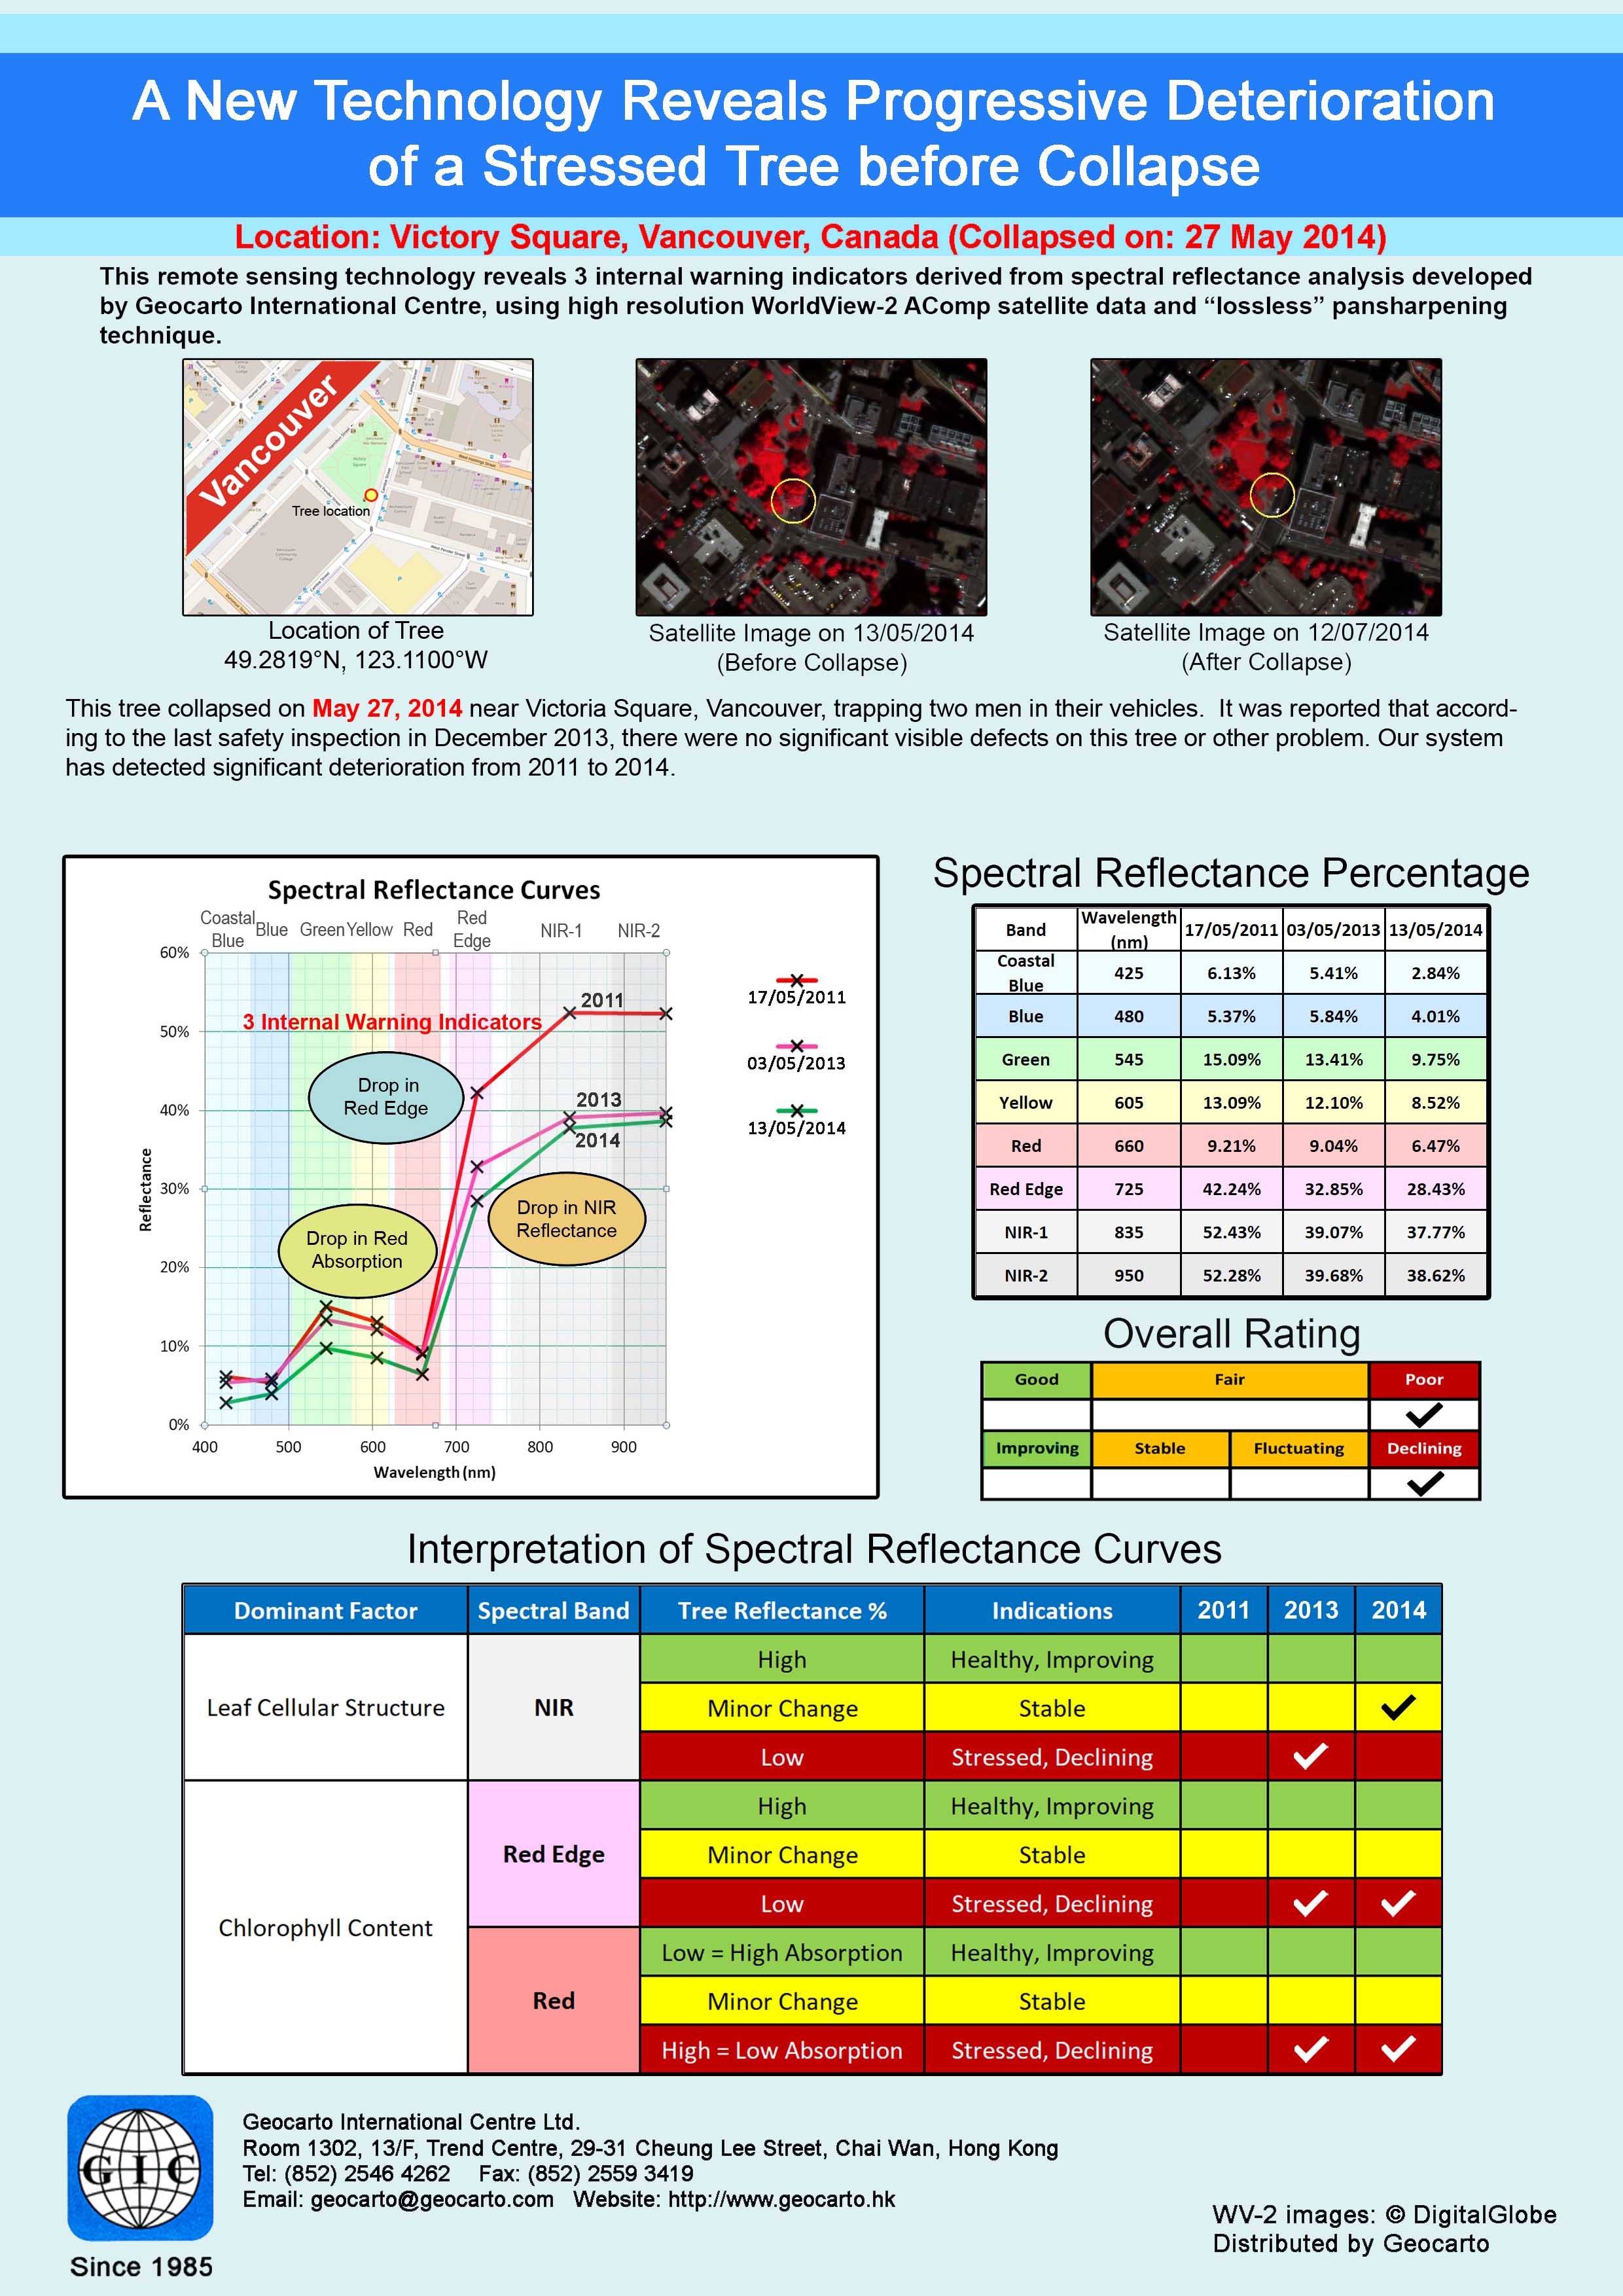 Chart 38Collapsed tree in Vancouver | 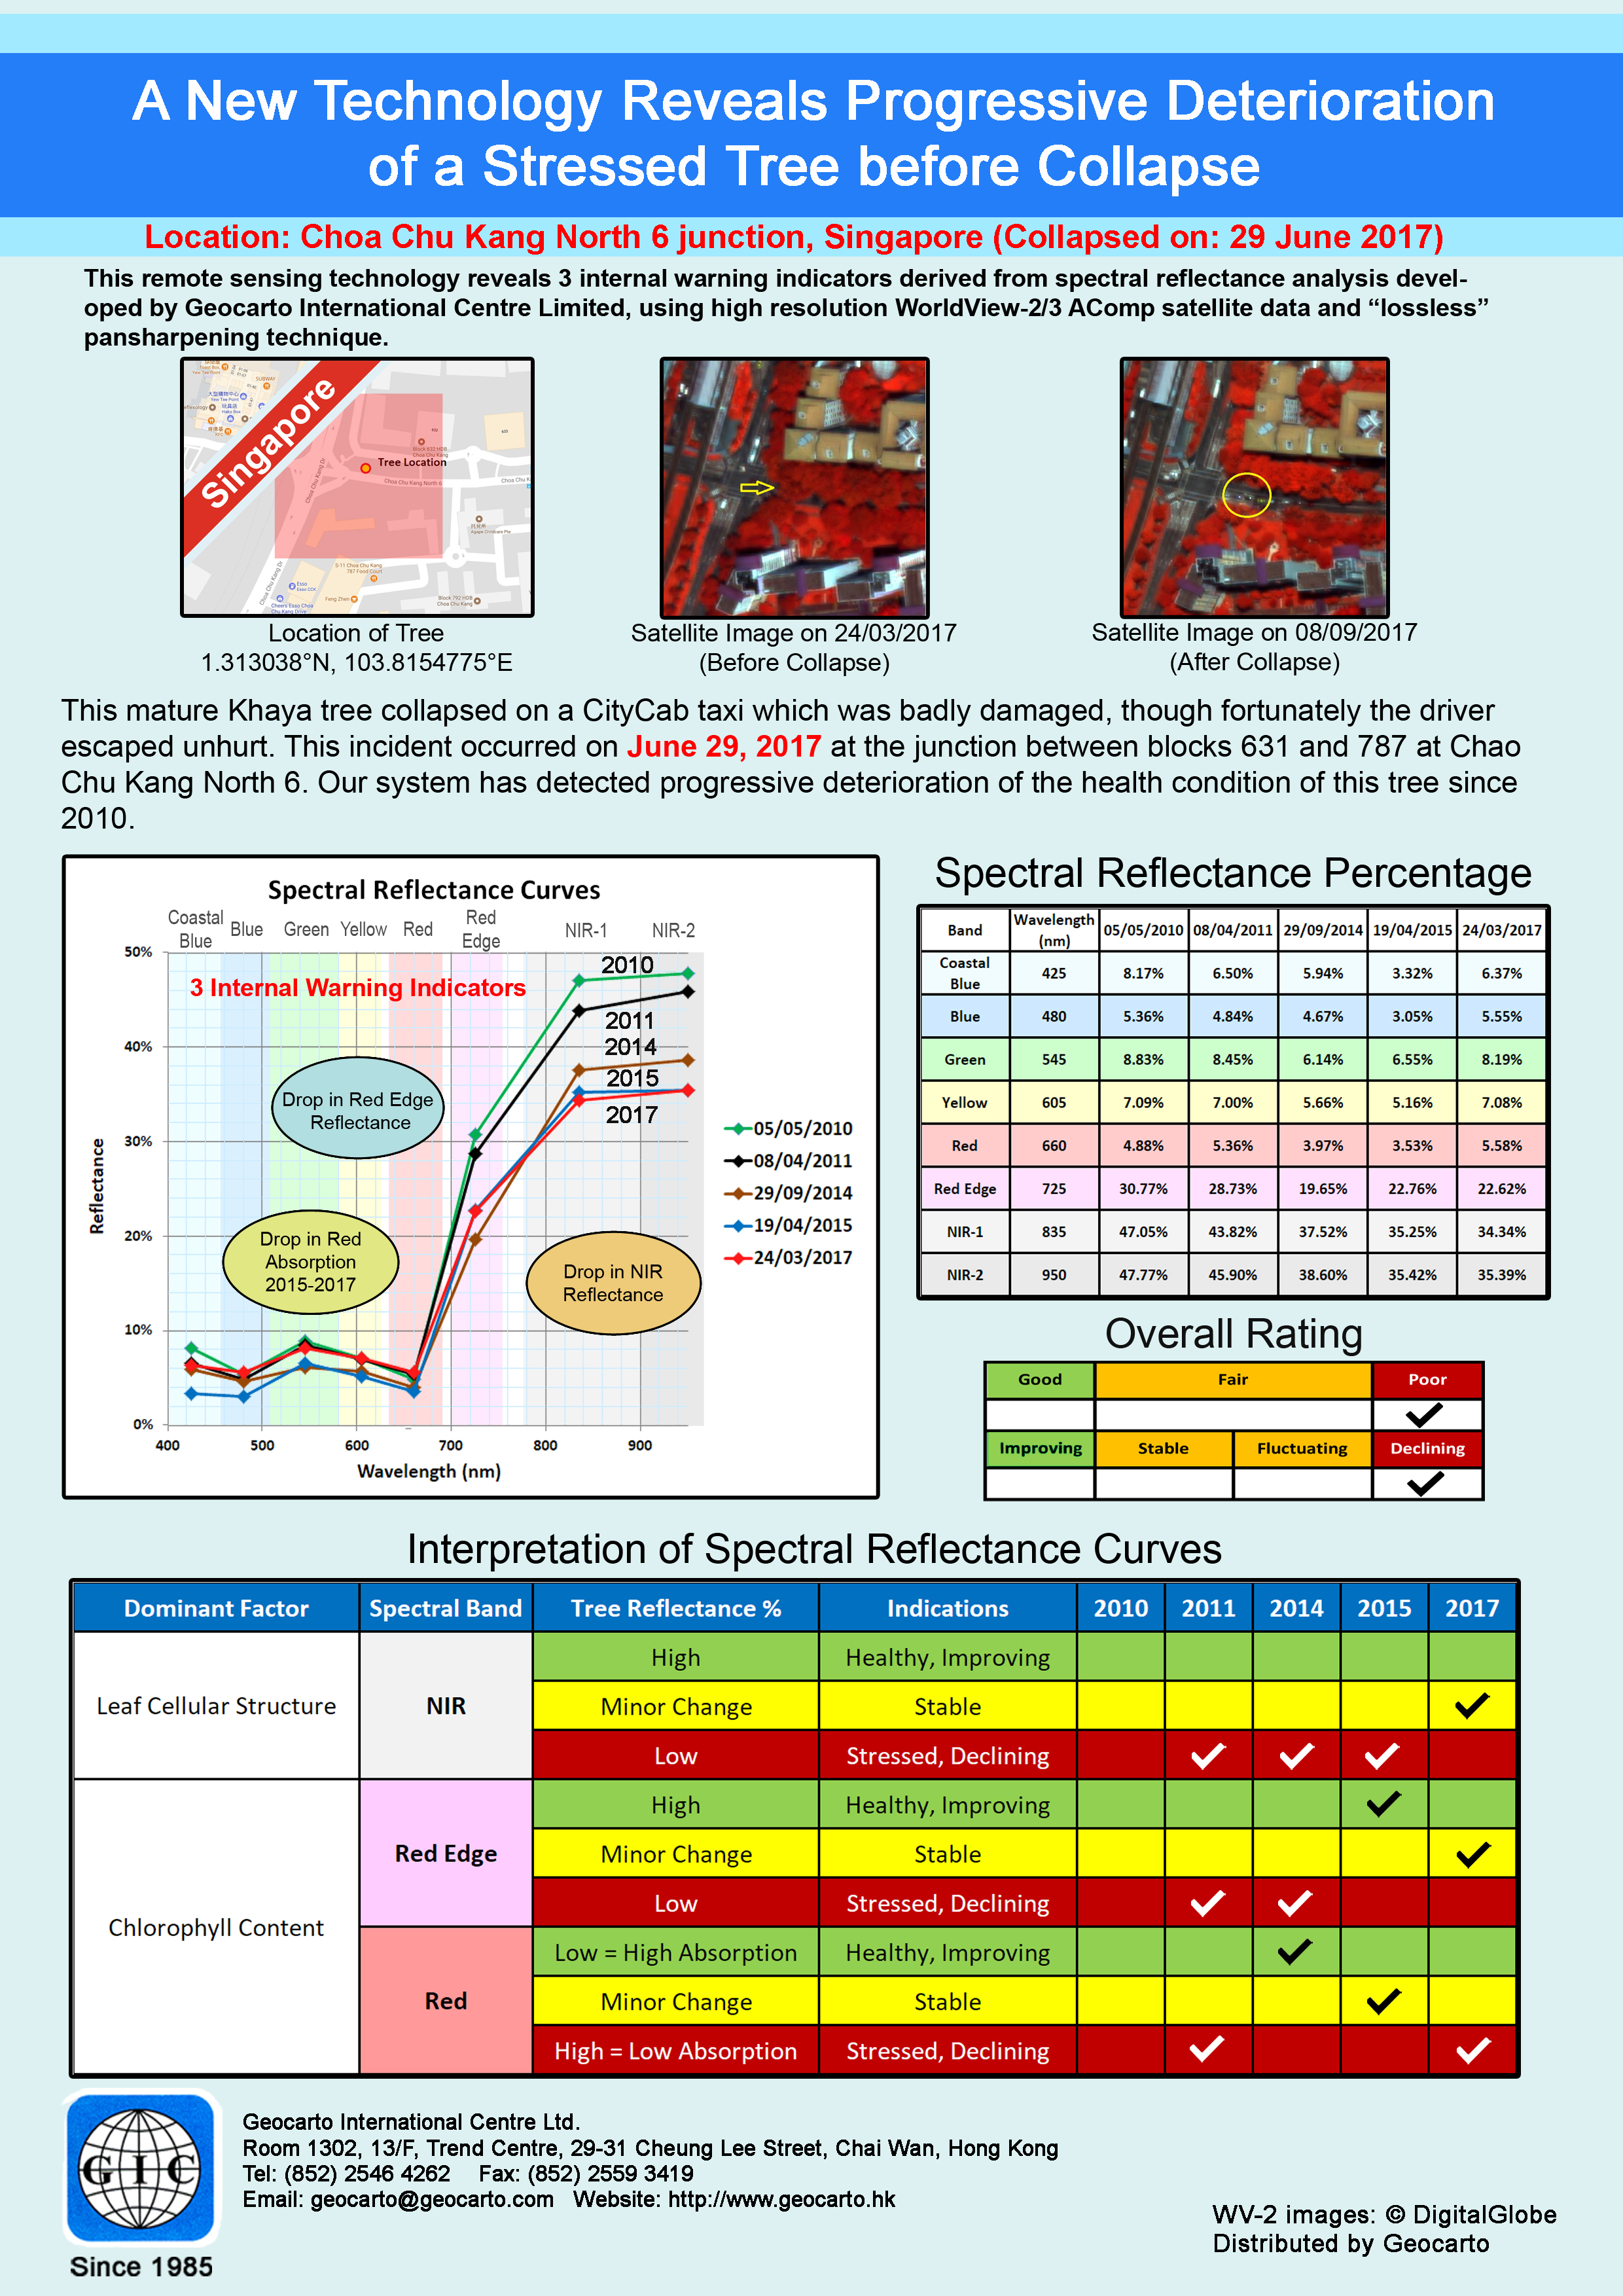 Chart 39Collapsed tree in Singapore |
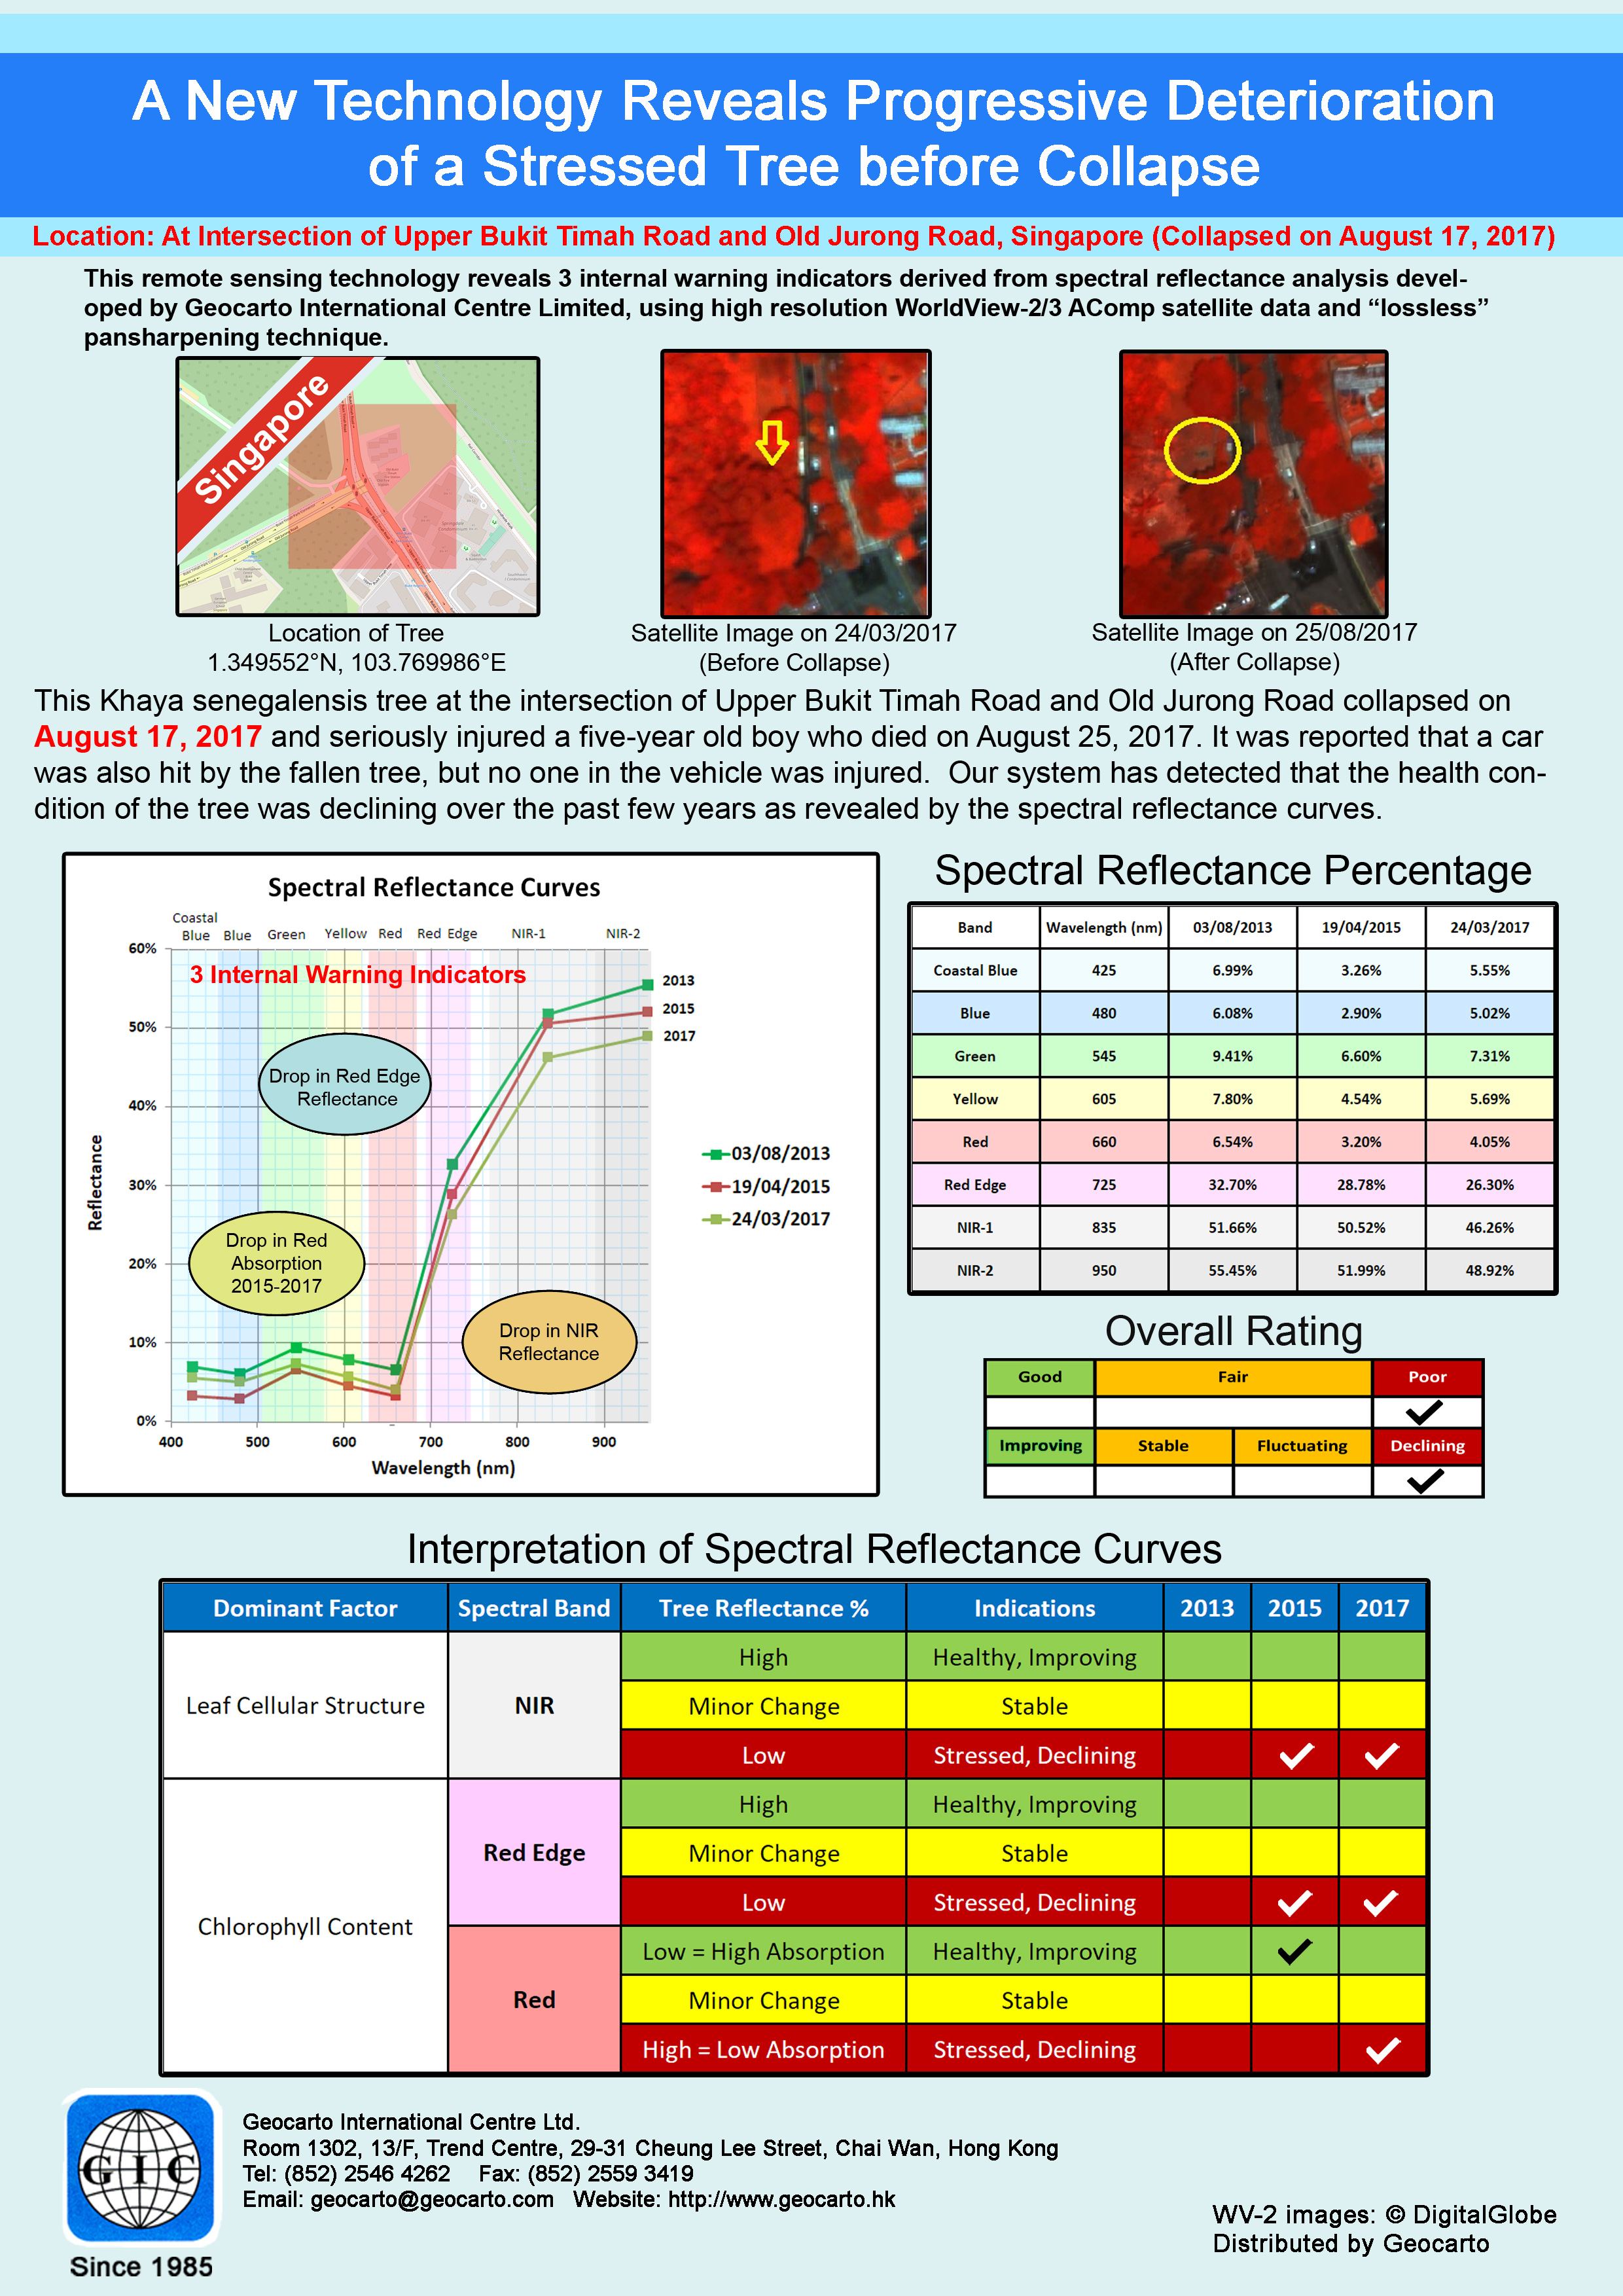 Chart 40Collapsed tree in Singapore |  Chart 41Removed tree in Lei Yue Mun Park | 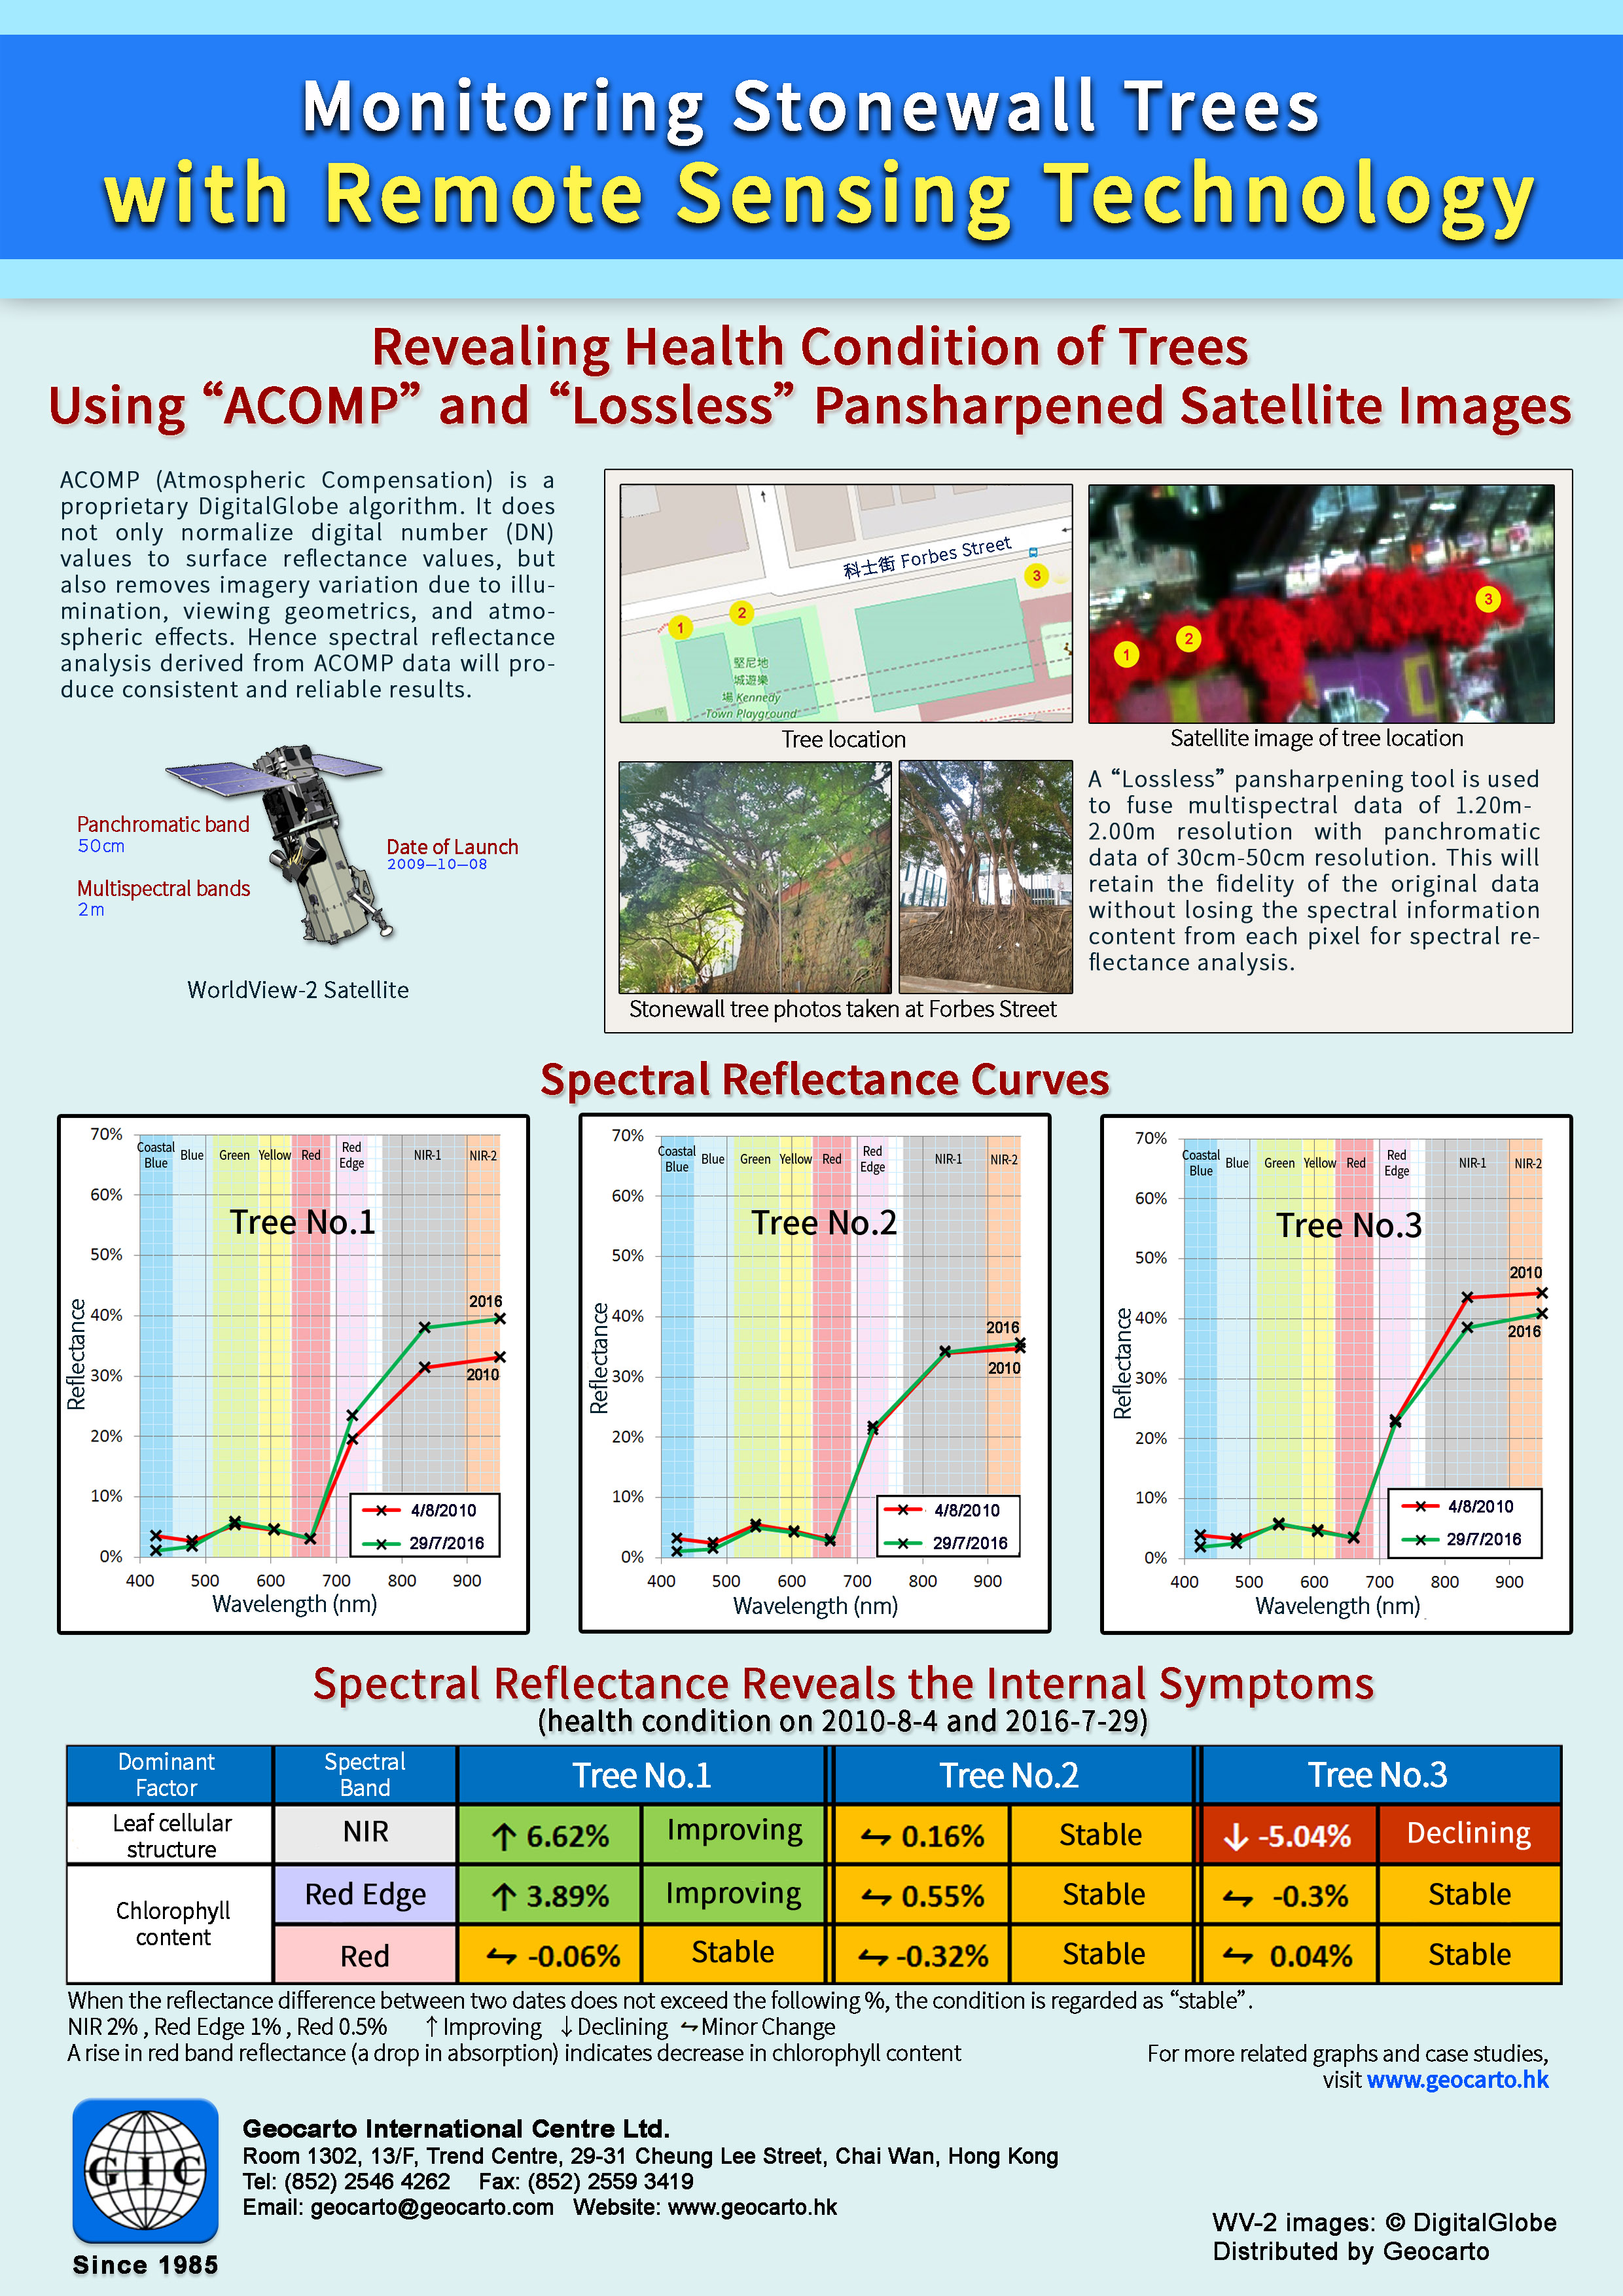 Chart 42Stonewall Tree in Forbes Street |
 Chart 43A stressed tree before death |  Chart 44Detected highly fluctuating health condition of a tree prior to collapse |  Chart 45Biotic and Abiotic Factors |
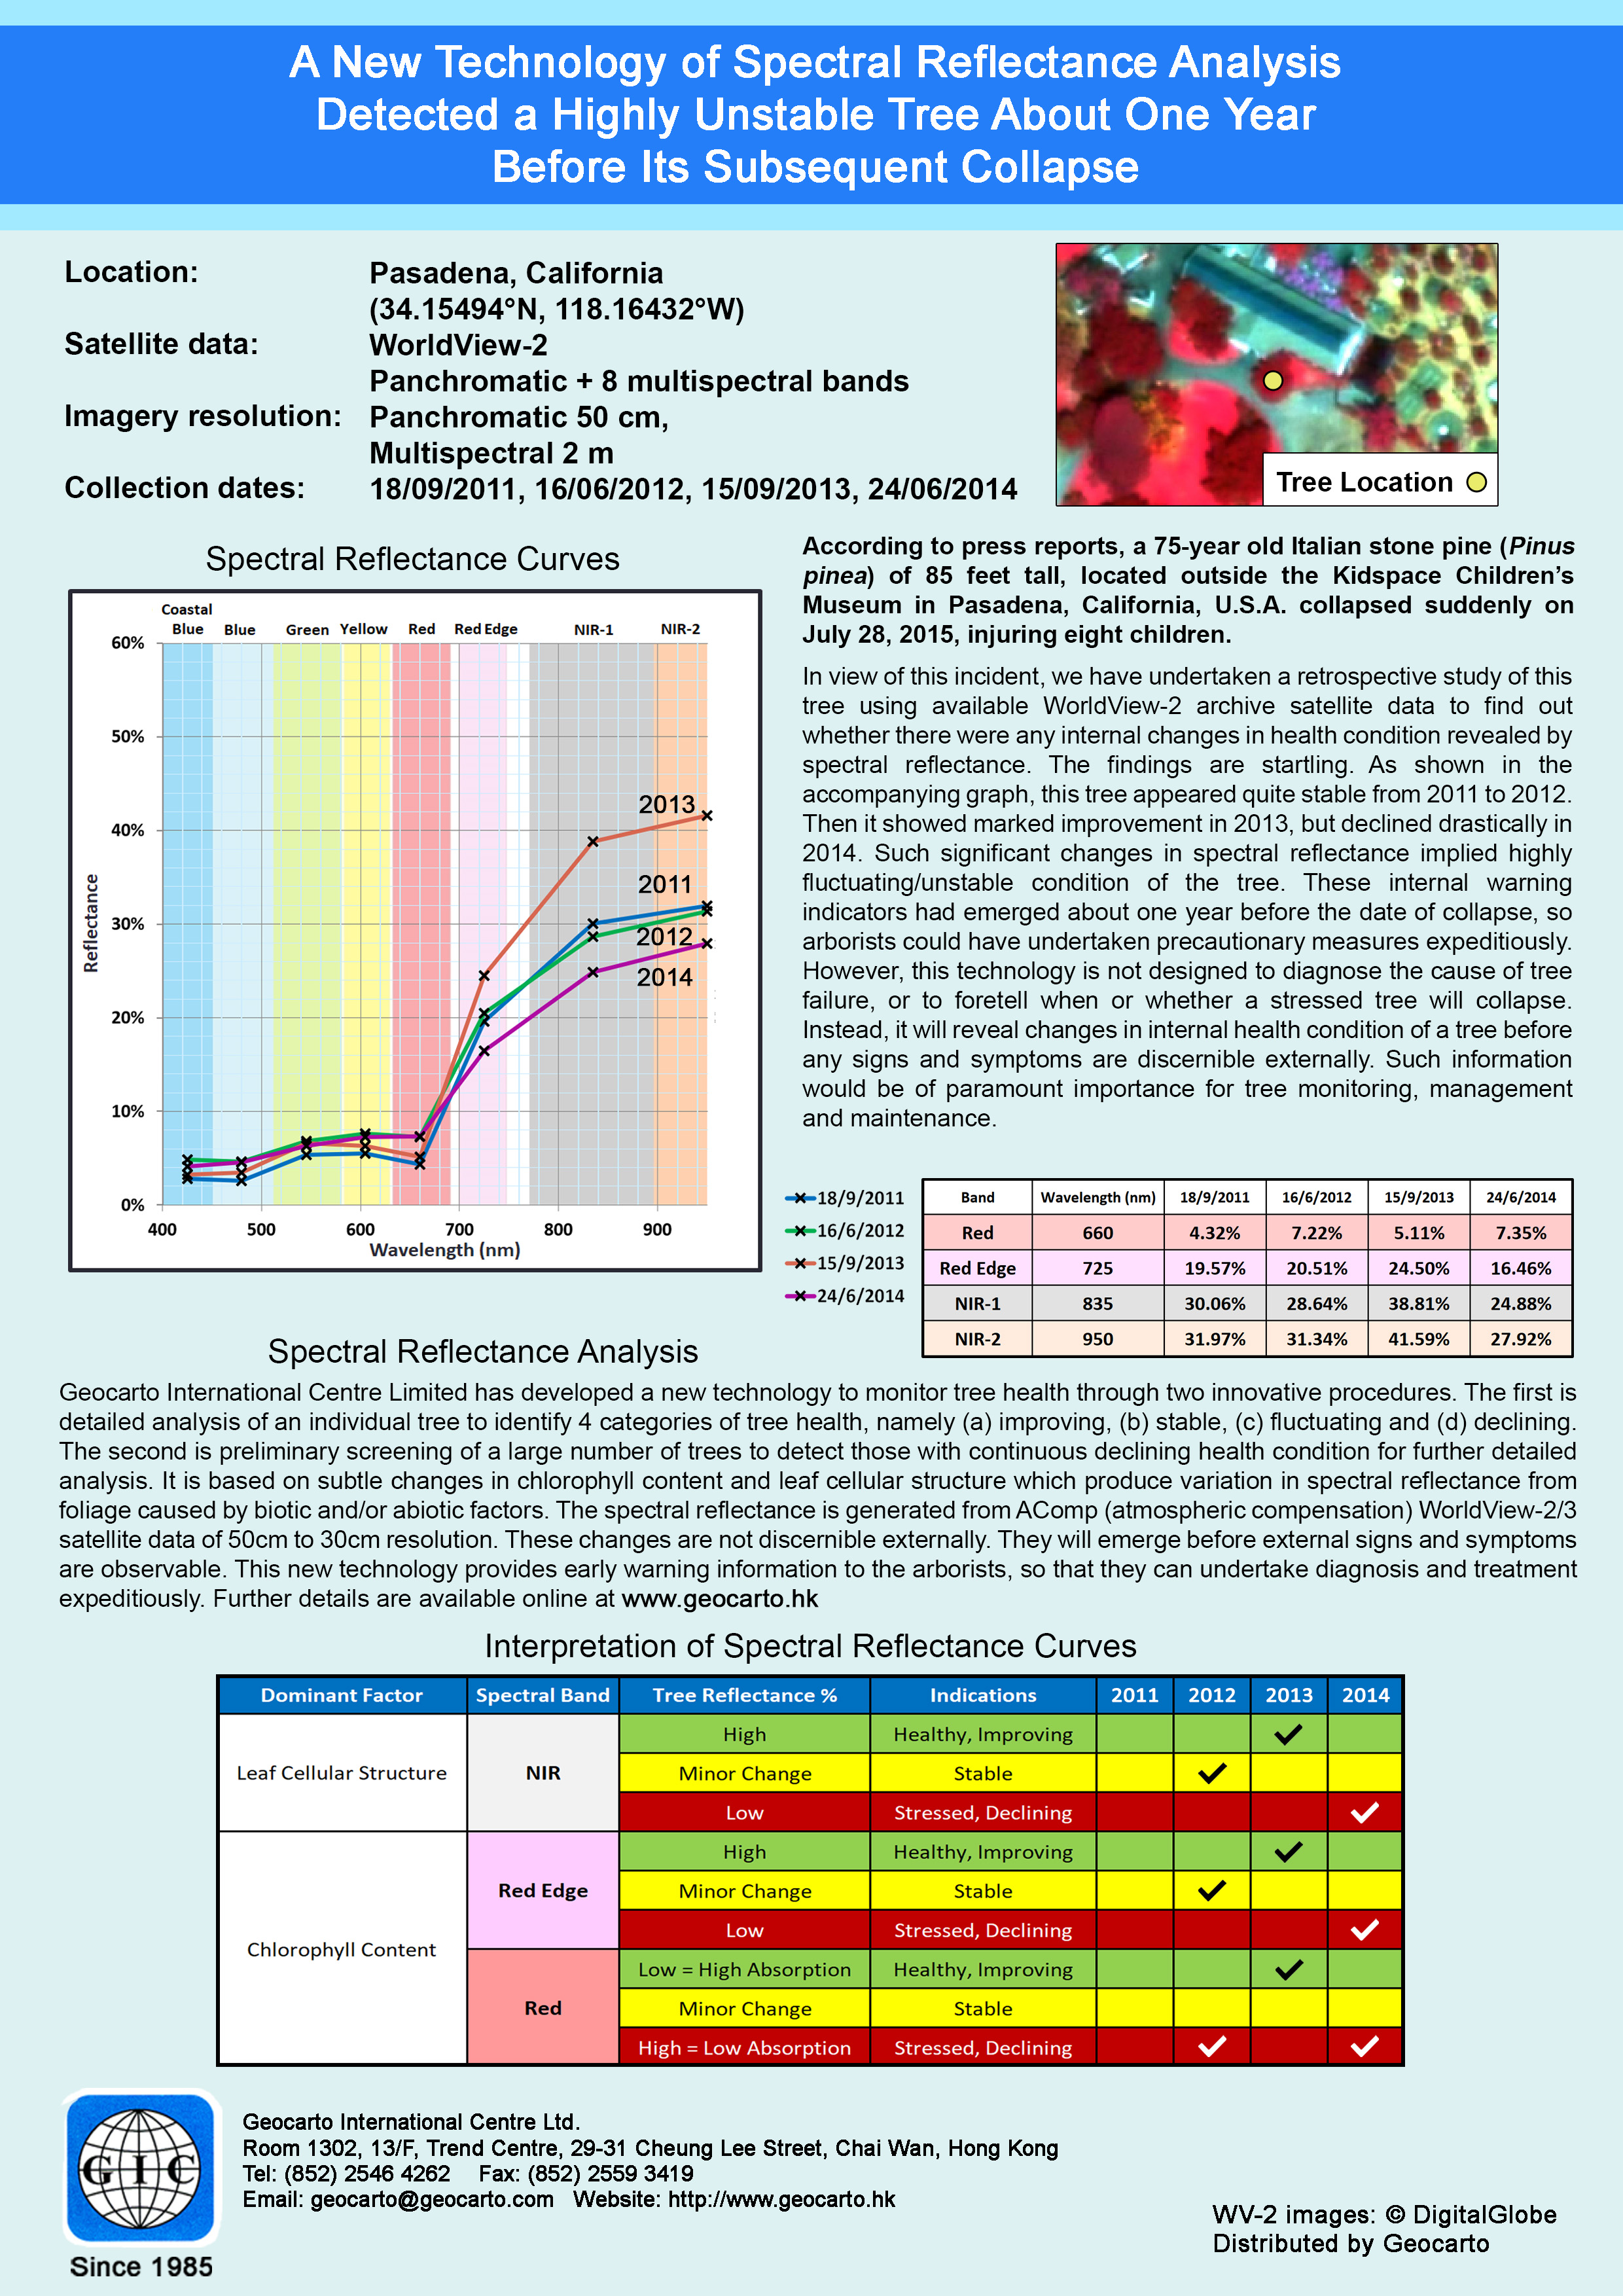 Chart 46Collapsed Tree in Pasadena |  Chart 47Collapsed Tree in Stubbs Road |  Chart 48Monitoring of an Old and Valuable Tree (2010 - 2020) |
 Chart 49Collapsed Tree in Marsiling Park, Singapore |  Chart 50Collapsed Tree in Central Park, New York |  Chart 51Collapsed Trees in South Asia |
 Chart 52Removed Trees on Bonham Road, The University of Hong Kong |  Chart 53Spectral Reflectance Analysis Can Detect Internal Abnormalities (English Version) | Chart 54Spectral Reflectance Analysis Can Detect Internal Abnormalities (Chinese Version) |
 Chart 55Collapsed Tree at Perth Street, Hong Kong (English Version) |  Chart 56Collapsed Tree at Perth Street, Hong Kong (Chinese Version) |  Chart 57Spectral Reflectance Abnormalities of termite-infested trees |
 Chart 58Tree Health Assessment (misconceptions of NDVI usage) |  Chart 59Satellite coverage in Greater Bay Area |  Chart 60Satellite coverage in Greater Bay Area |
 Chart 61Assessing the health of the collapsed tree on Perth Street, Hong Kong |  Chart 62Assessing the health of the collapsed tree on Perth Street, Hong Kong |  Chart 63Two Impact Factor Analysis on Termite-infested trees |
 Chart 64Chinese SuperView Neo 3-01 and 3-02 Satellites |  Chart 65Chinese SuperView Neo 3-01 and 3-02 Satellites |  Chart 66Effective Use of Two Impact Factor Analysis on Monitoring Tree Health |
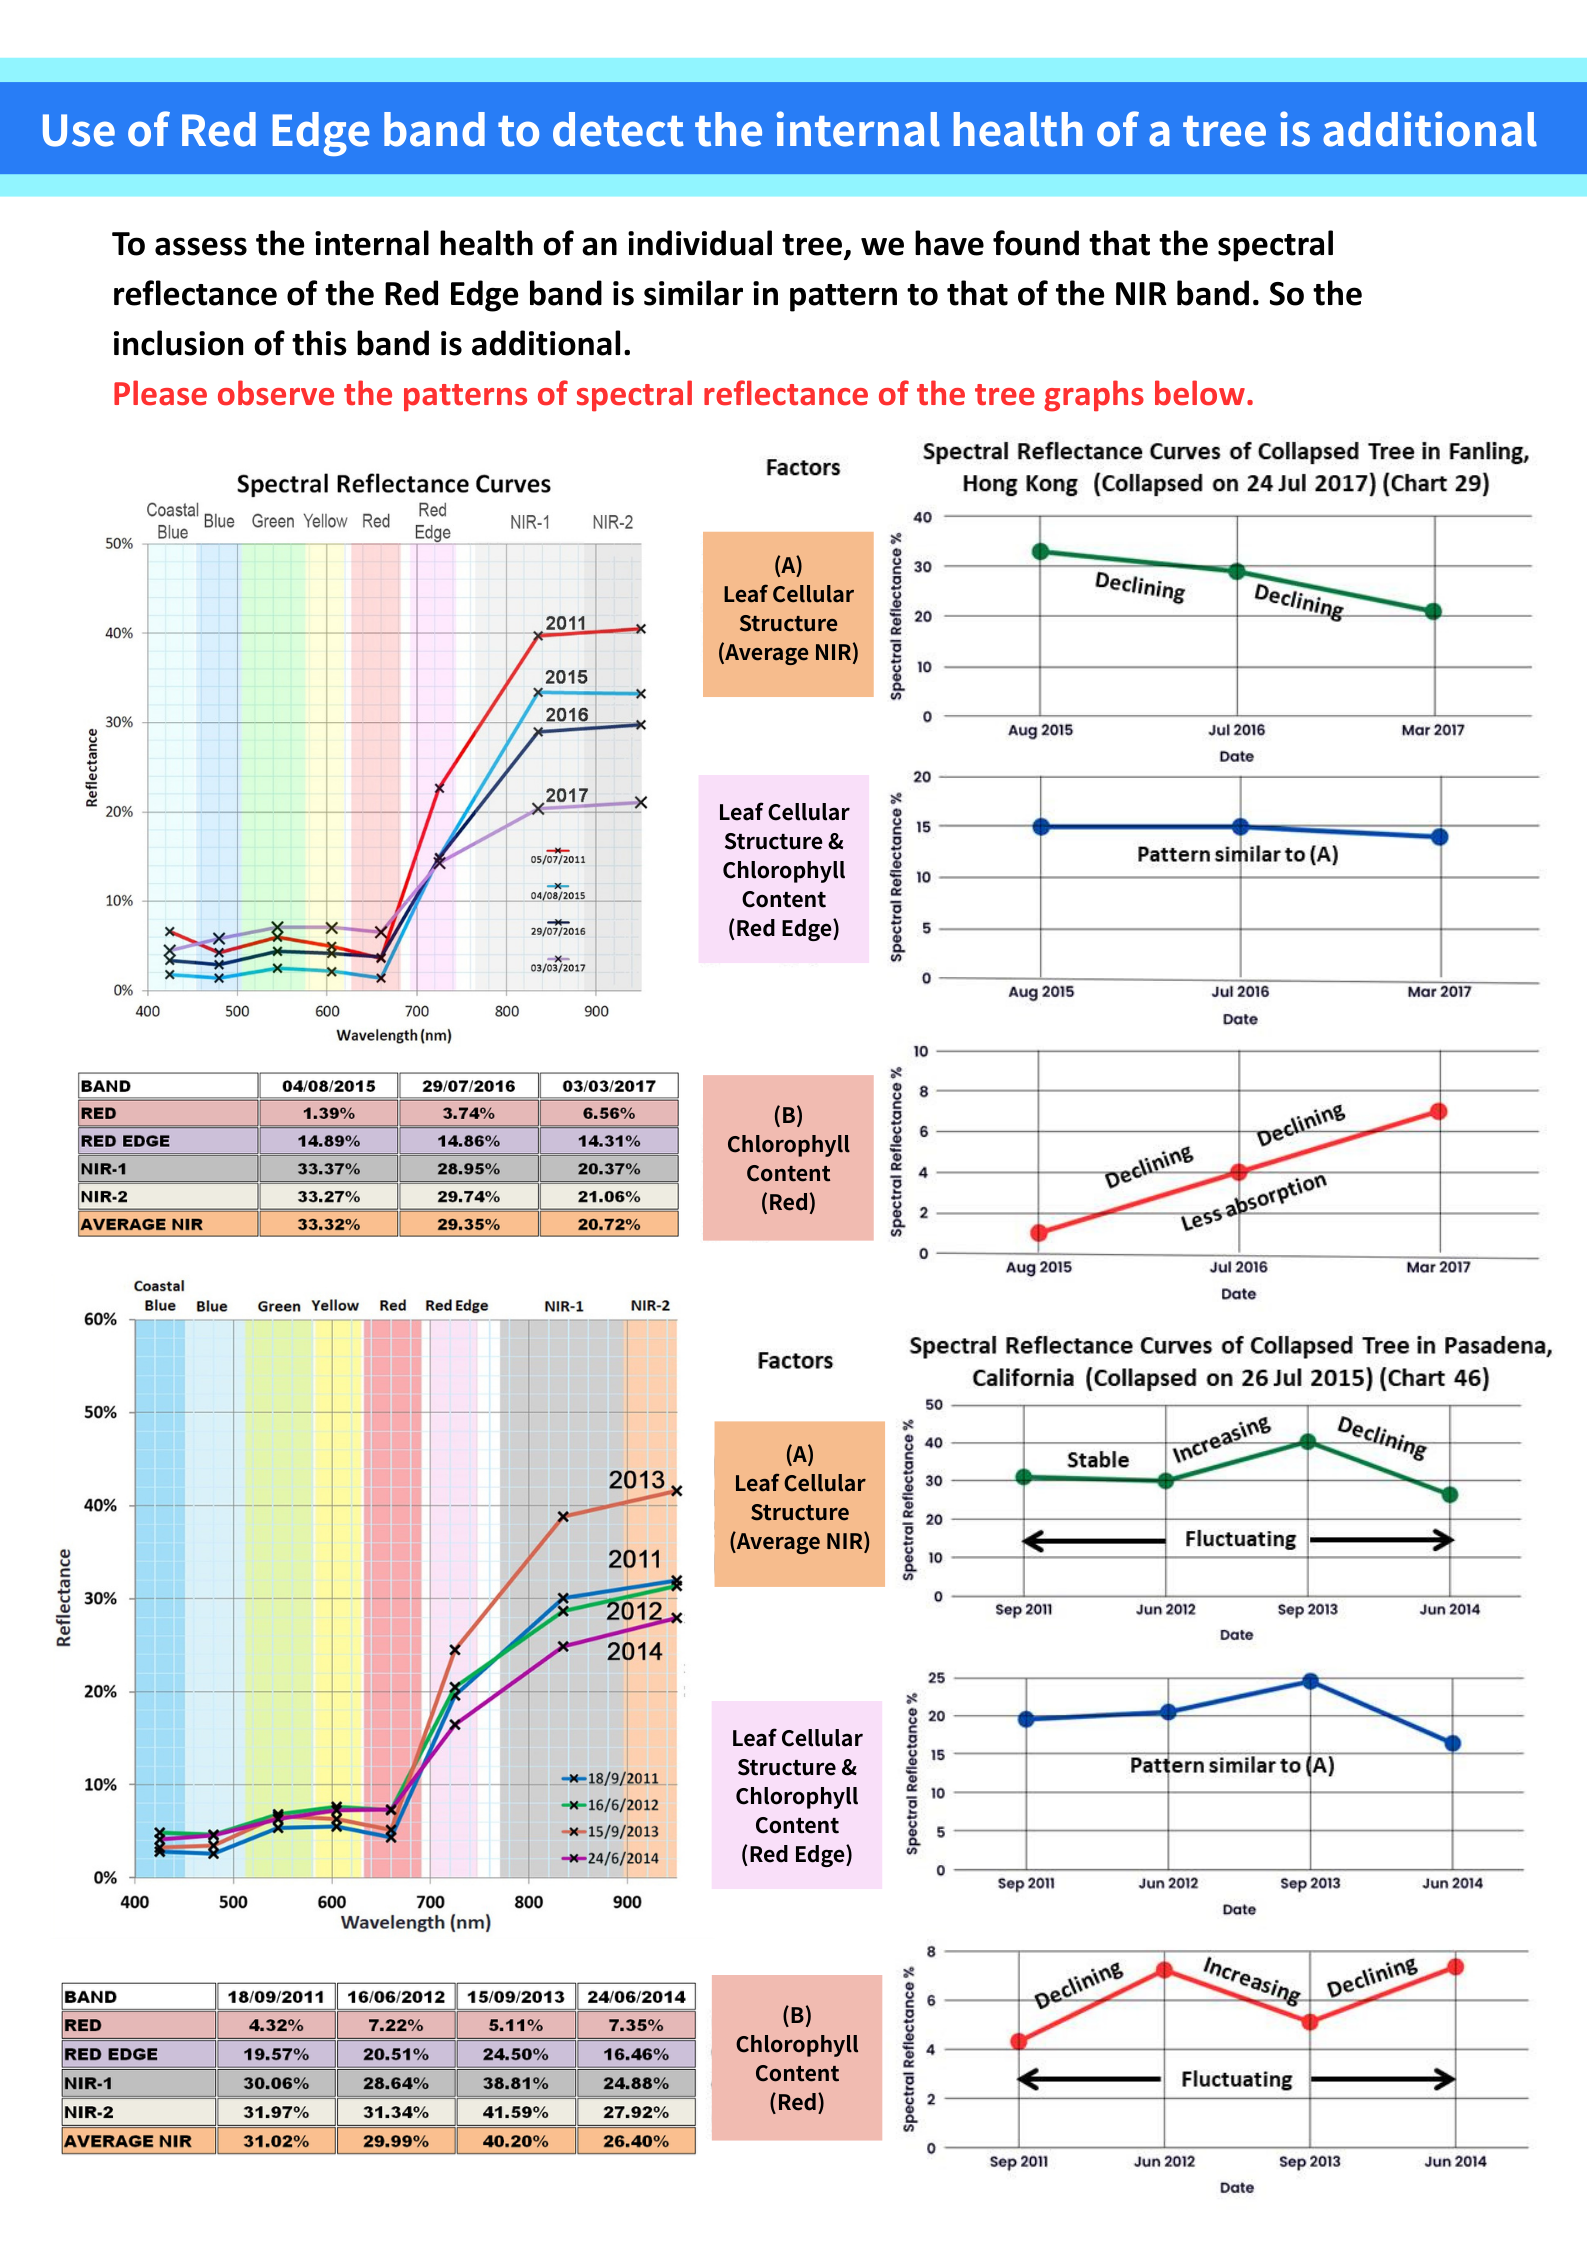 Chart 67Red Edge Reflectance Curve | 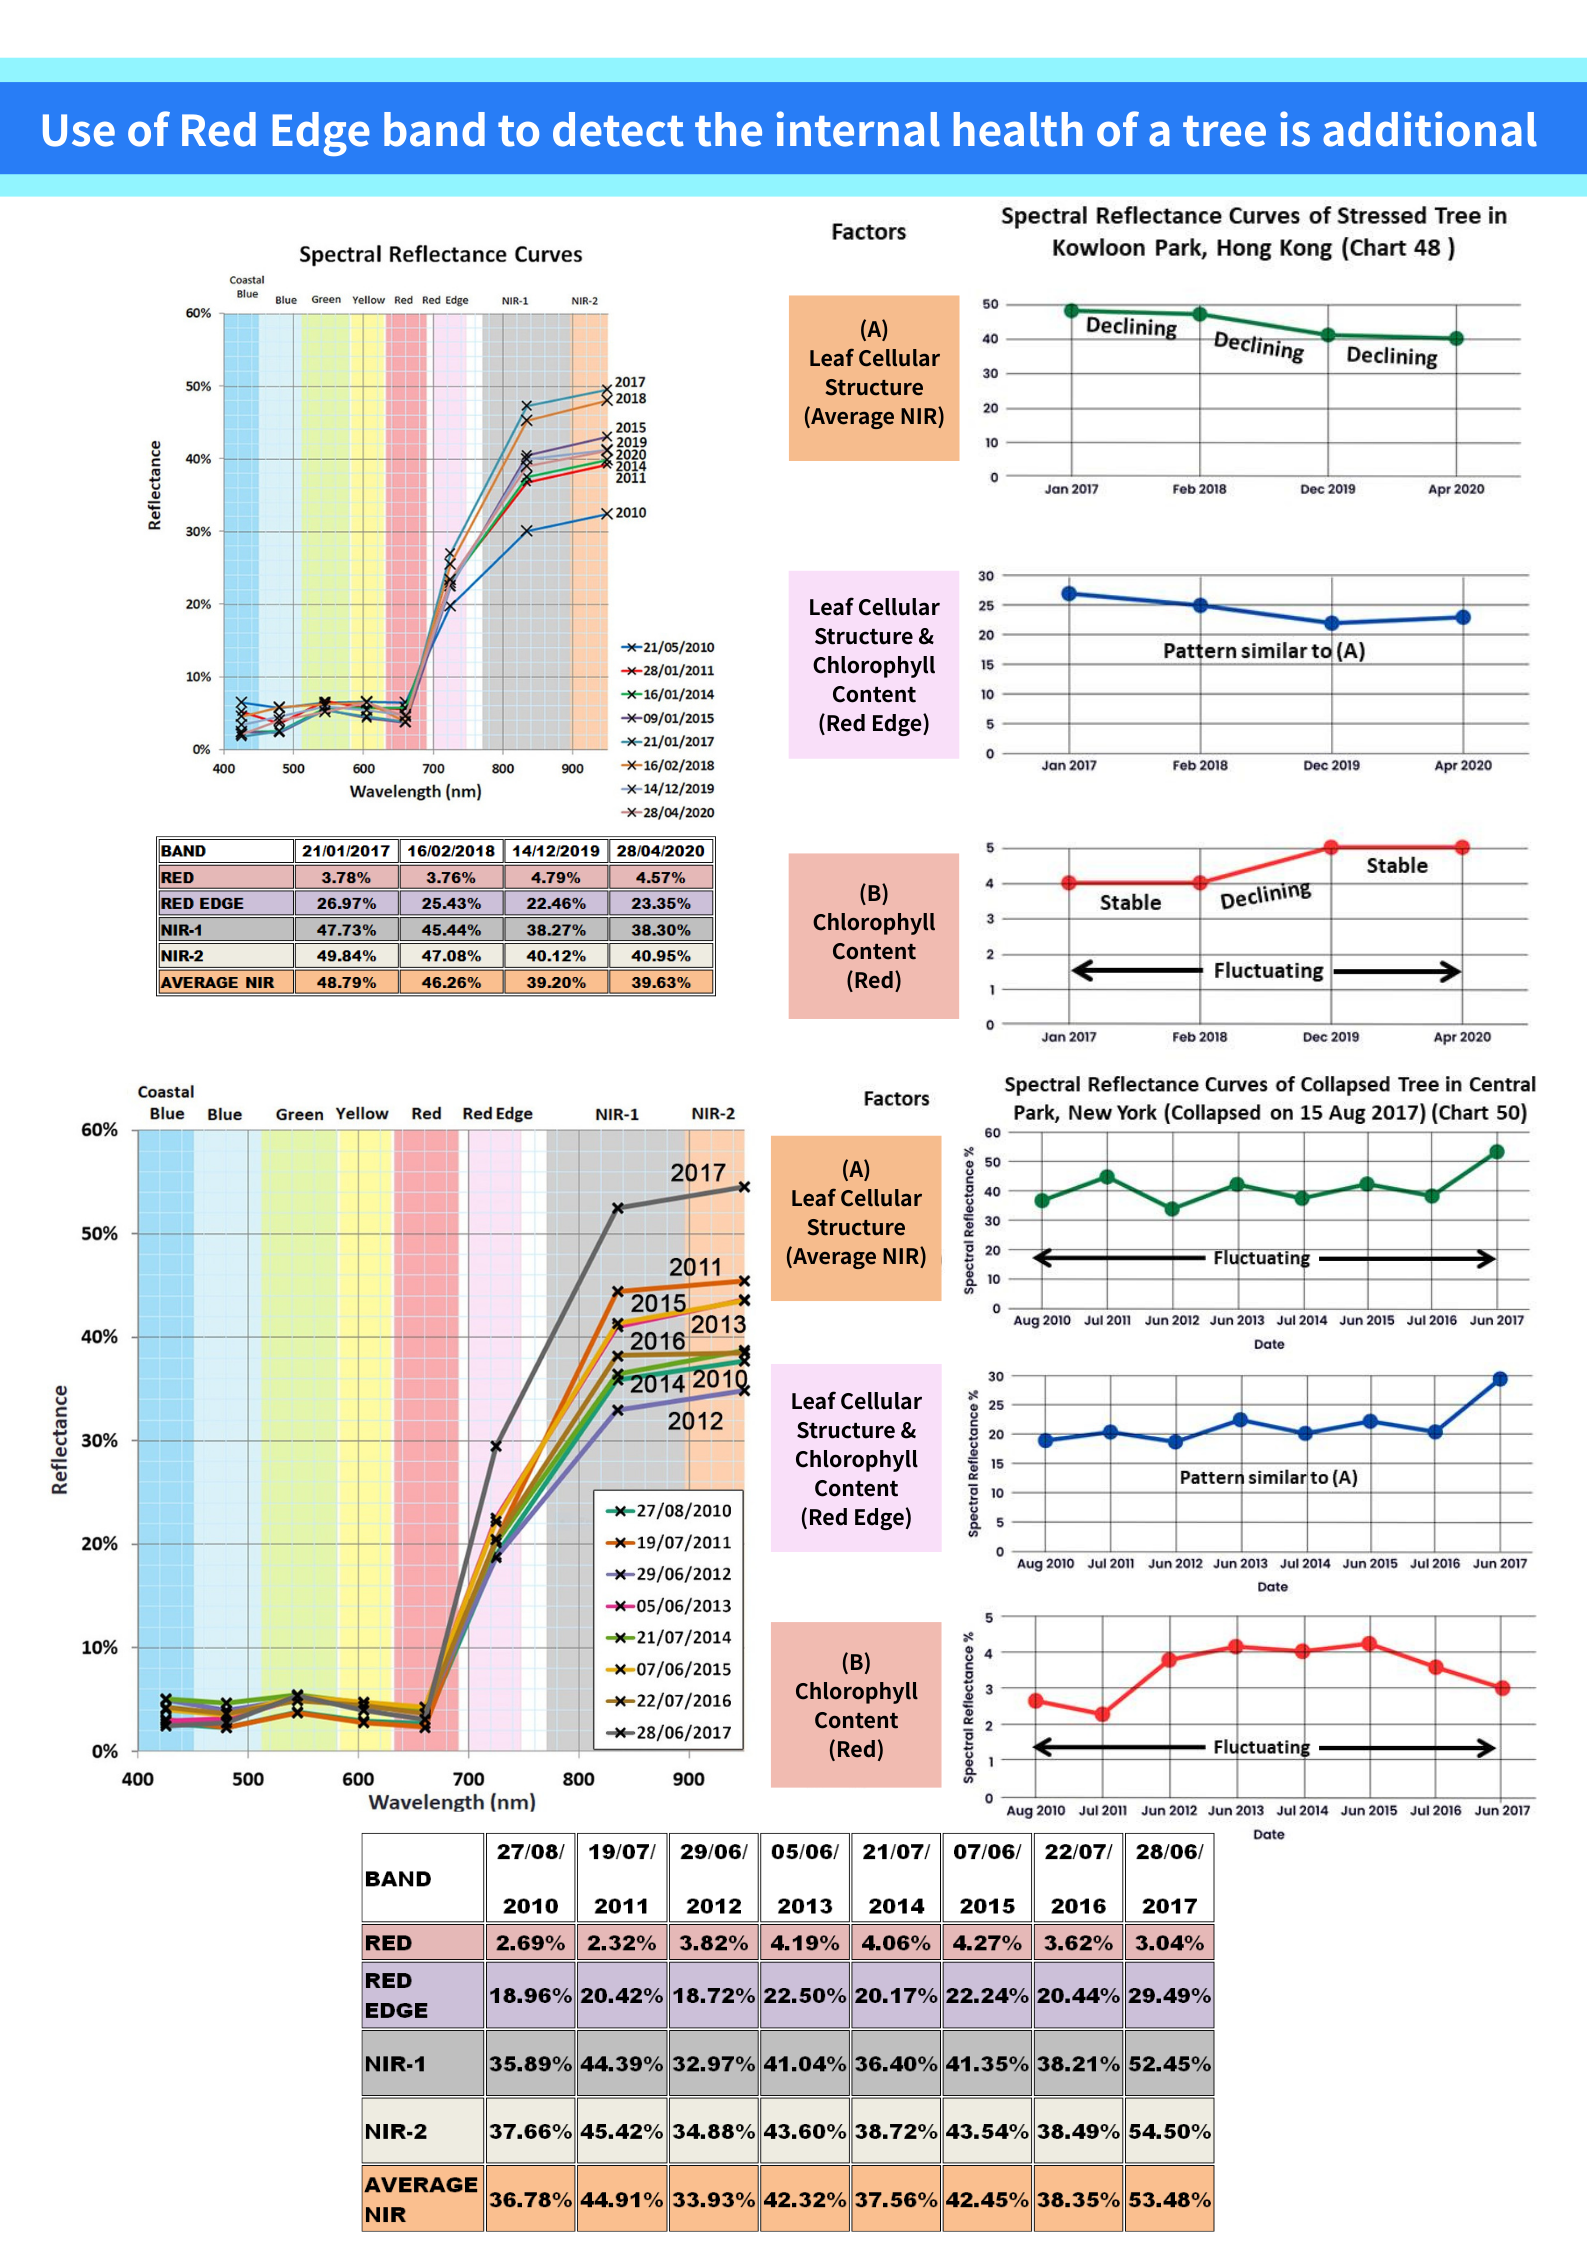 Chart 68Red Edge Reflectance Curve | 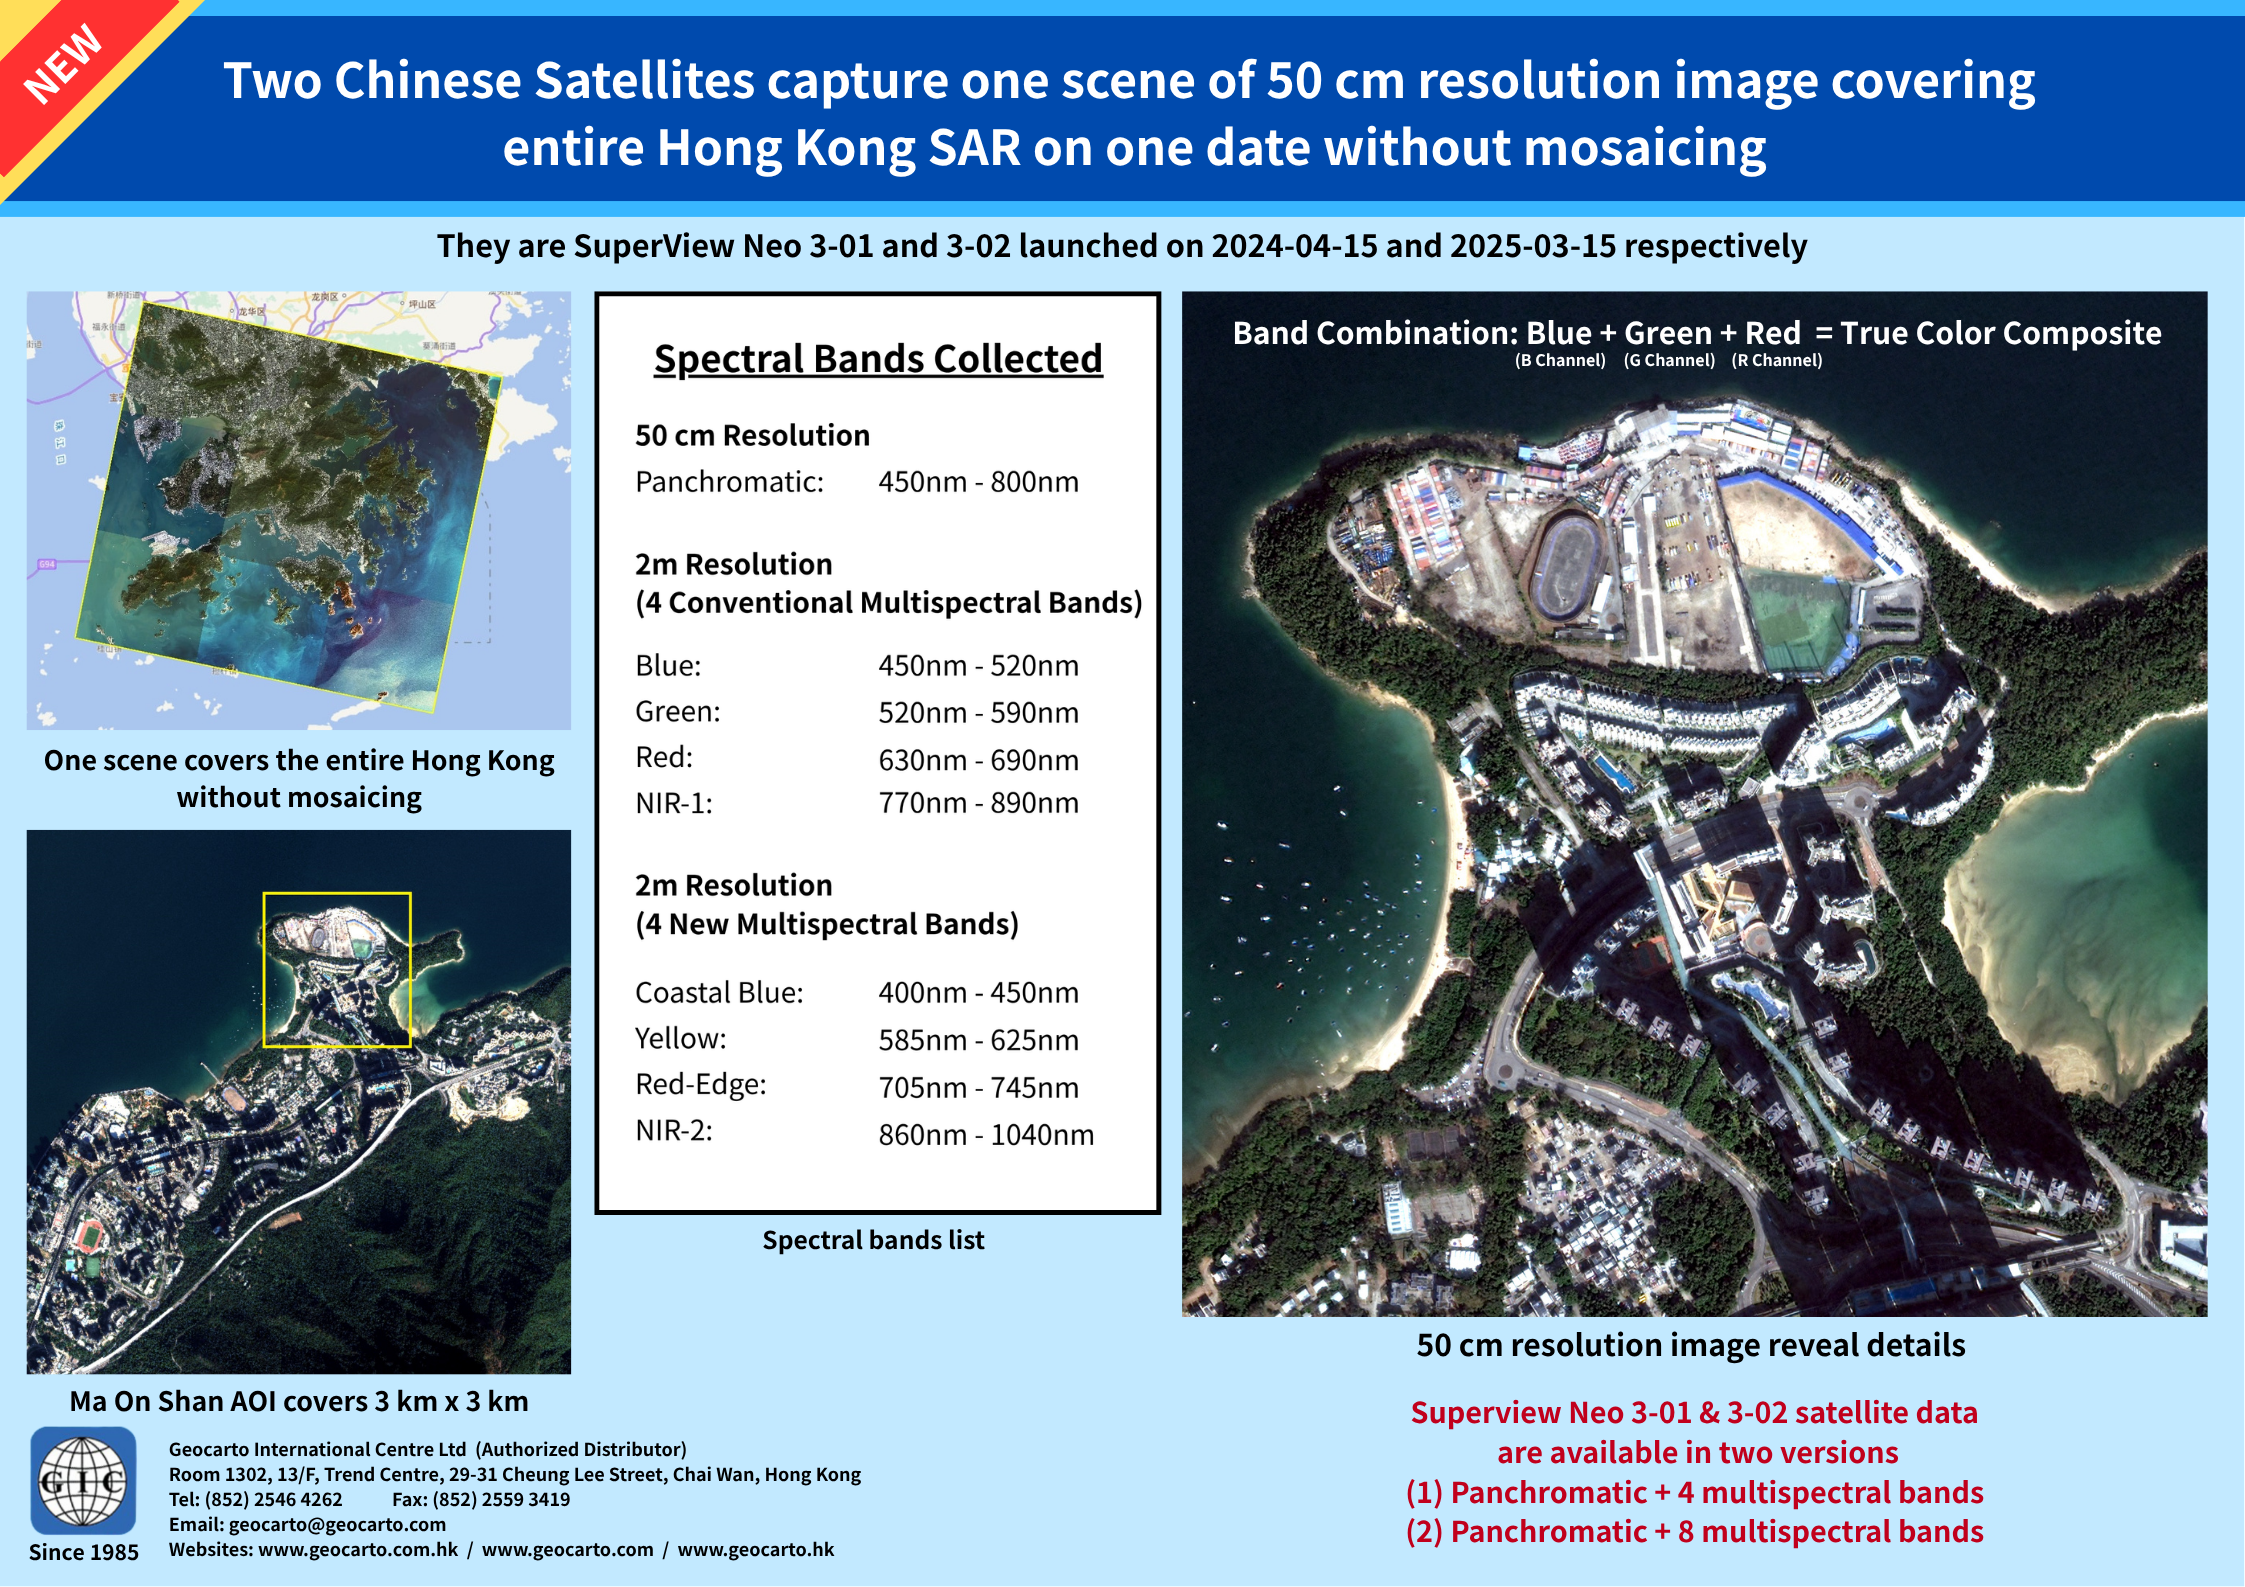 Chart 69SuperView Neo 3-01 & 3-02 Satellites |
 Chart 70Surface Reflectance Comparison |  Chart 7115 Trees infested with termites |  Chart 7215 Trees infested with termites |


Data Cost
(AComp data and "Lossless" pansharpened data)
Satellite
Resolution
Number of Bands
Cost of satellite data per km
Name
WorldView-2
WorldView-3
Company
DigitalGlobe, Inc
Launch Date
2009-10-8
2014-8-13
Coverage
Satellite data of 60km x 60km to cover the whole HKSAR can be acquired in a single pass
Panchromatic
50 cm
30 cm
Multispectral
1.84 m
1.24 m
More than 90 days
US$ 19
Less than 90 days
US$ 24
US$ 29 (8 bands)
US$ 34 (8 bands)
Geocarto is the sole reseller of WorldView-2 & WorldView-3 satellite data in Hong Kong and Macau.

Questions
Questions and answers on Tree Stress Study
Thank you for viewing these tree stress study charts. They are designed to explain the applications of high resolution satellite remote sensing technology in monitoring tree stress in Hong Kong. The following questions cover the main points presented in the charts. Can you answer these questions?
-
What is the difference in the number of spectral bands between WoldView-2 and WorldView-3 data?
-
Can WorldView-2 and WorldView-3 data be used together for monitoring the same tree?
-
What is the main function of hyperspherical direction cosine transformation (HSDC)?
-
What is the highest spectral reflectance of healthy Chinese banyan (Ficus microcarpa) shown in the charts?
-
What is the lowest spectral reflectance of stressed Chinese banyan shown in the charts?
-
What is Red Edge Shift?
-
Is there a drop in NIR spectral reflectance due to reduction in chlorophyll?
-
What are the warning signs shown in the spectral reflectance curves of stressed trees before collapse?


View the answers

CONTACT US
Geocarto International Centre Ltd.
Room 1302, 13/F, Trend Centre,
29-31 Cheung Lee Street,
Chai Wan, Hong Kong
Tel.: (852) 2546 4262
Email: geocarto@geocarto.com
For any general inquiries, please fill in the following contact form: